Curated OER
Slopes and Slope Intercepts
Students identify the slope of an equation using various methods. In this algebra lesson, students graph linear equations and calculate the slopes using the x and y intercept to solve the equations and graph the lines. They use the slope...
Curated OER
Writing Linear Equations
In this Algebra I/Algebra II worksheet, students examine linear equations to determine the slope and y-intercept and write the equation of the line given the pertinent information. The one page worksheet contains a combination of...
Texas Instruments
Mean Value Theorem
Students calculate the slopes of secant lines. In this calculus lesson, students graph tangent and secant lines using the coordinate plane. They use the Ti calculator to graph and observe the lines.
Curated OER
Traveling Through the Solar System
Students use calculator and non-calculator methods for analyzing data. They apply data collection and analysis in a study of mass and weight. Students enhance and apply the concept of line of best fit. They master graphing in a plane,...
Curated OER
Data Analysis and Probability Race to the Finish
Students practice addition facts, record data, and construct a bar graph. In this probability lesson, students participate in a board game in which bicycles move towards a finish line based on players completing addition problems. Dice...
Curated OER
Density of Pennies Lab
In this density of pennies worksheet, student conduct an experiment to determine the metals used in the core of pennies made after 1983. Students design their own experiments using a balance and graph paper to determine the density of...
Curated OER
Jack and the Beanstalk Math
Students listen to Jack and the Beanstalk and determine what they think are the most common words. In this Jack and the Beanstalk lesson, students reread the story, count the words they chosen and graph those words. Students graph...
Curated OER
AP Calculus Practice Exam: BC Version - Part A
In this calculus learning exercise, students solve 28 multiple choice problems. Students find derivatives, volumes, limits, convergent series, etc.
Curated OER
Algebra 2 Test
In this algebra worksheet, students solve problems by graphing inequalities, finding the slope of a line and identifying functions. This is a review of chapter 2 on an algebra test. There are 21 questions.
Curated OER
Systems of Equations
In this Algebra 2 instructional activity, students solve systems of equations and inequalities then graph the solutions on a number line. There are 11 problems to solve.
Curated OER
Download and Analyze
Students download information from a NASA website into a database. They transfer it to a spreadsheet by completing the information and analyze the information. They determine temperature averages, mode, and graph the results. They write...
Curated OER
Shaky New Zealand
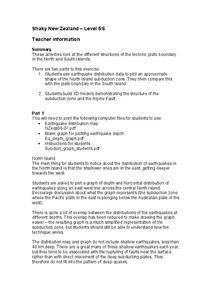
Students explore Earth science by building a model in class. In this tectonic plate lesson, students identify the impact tectonic shifts have on humans and animals and where the plates and faults lie under New Zealand. Students examine...
Curated OER
Strike a Pose: Modeling in the Real World (There's Nothing to It!)
Adjust this lesson to fit either beginning or more advanced learners. Build a scatter plot, determine appropriate model (linear, quadratic, exponential), and then extend to evaluate the model with residuals. This problem uses real-world...
Curated OER
Math Journal: Functions and Coordinate Geometry
Fifth graders examine the many uses of coordinate grids. For this graphing lesson, 5th graders write data driven equations, discuss the x and y-axis, and determine if using 2 or 3 ordered pairs is better. Students complete several...
Curated OER
Use the Grid to Answer the Questions
In this algebra worksheet, students identify the points on a graph and make sure the lines satisfy the conditions placed on the values.
Curated OER
Celsius to Fahrenheit
Students convert degrees between two different units. In this algebra lesson plan, students graph linear equations and identify the line of best fit. They use their line of best fit to make predictions given a set of data.
Curated OER
Ready, Set, Go!
Students predict if the height of a ramp affect how far an object travels. They design and conduct an experiment to test their predictions. The results are recorded and a graph is created to show the relationship between ramp height and...
Curated OER
How Does Your KinderGarden Grow
Students find forecast and graph weather by using WeatherBug site, create flower books by using Wiggleworks, and plant radish seeds both on KidPix and in class garden.
Curated OER
Slope Exploration
In this slope exploration worksheet, 9th graders solve and complete 18 different problems that include graphing and investigating the slope of various equations. First, they graph each pair of points and draw a line that contains both...
Curated OER
Thermometric Titration
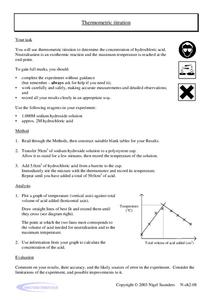
In this thermometric titration worksheet, students titrate hydrochloric acid with sodium hydroxide to determine the concentration of hydrochloric acid. They measure the change in temperature of the solution, plot their data and use the...
Curated OER
Hurricane Paths: Comparing Places with Different Prevailing Winds
In this wind worksheet students study a wind rose and graphs for Boston and answer several short answers on prevailing winds.
Curated OER
EOC Review G
For this end of course review, students factor expressions, interpret statistic problems, and identify the maximum and minimum of equations. This two-page worksheet contains 5 multi-step problems.
Curated OER
Solving Inequalities
In this inequalities worksheet, students solve and graph inequalities. They shade the answer region. Explanations and examples are provided at the beginning of the document. Answers are at the end of the worksheet. This four-page...
Curated OER
The Ice Cream Stands Problem
Tenth graders pretend to set up an ice cream shop in a make believe town of shapes. In this geometry lesson, 10th graders work together to put up an ice cream stand in an ideal location and solve for the minimum given the...


