Curated OER
Butterflies in the Garden
Students estimate the population of a butterfly ecosystem and create a chart and graph based on information they find.
Curated OER
Science: Observing Fish Behavior
Fifth graders, working in pairs, select and observe fish in the Aquademics aguarium. They record their observations on worksheets and make graphs displaying the frequency of various fish behaviors. Students then discuss their...
Curated OER
Using a spreadsheet and the Internet to learn about stock market performance
High schoolers record the progress weekly of a business of their choice on the stock market, graph those results, research and report on current news and how it pertains to the companies recent performance.
Curated OER
Unit 5: Worksheet 4 - Proportions
In this proportion worksheet, students use proportions to find the missing side of similar triangles, they identify the percent of a number, and graph points on a coordinate plane. Students solve real life story problems dealing with...
Curated OER
Time and Rate
In this rate graphing worksheet, students graph four examples of rate vs. time. Then students complete 20 short answer questions.
Curated OER
A Bar of Many Colors
Second graders use colored candies to collect data, construct double bar graphs, and find averages.
Curated OER
Body Proportion
Fourth graders measure the height and arm span of various classmates. They use a spreadsheet to design a graph that shows the class measurements from tallest to shortest in metric and standard systems.
Curated OER
Paper Parachutes
Students participate in a simulation of a parachute-jump competition by making paper parachutes and then dropping them towards a target on the floor. They measure the distance from the point where the paper parachute lands compared to...
Curated OER
Heat Loss
Students comprehend how heat loss is affected by exposed surface area. They decide what type of and how many data to
collect. Students decide how the results should be presented. They make a series of accurate observations
Curated OER
Heating Ice: The temperature of ice and water when heated
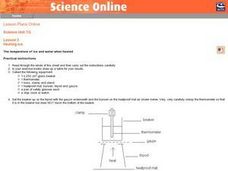
Seventh graders read and follow the instructions on the worksheet. They make a table of their results. Students use about 100 cm^3 of water and ice mixture. They heat the water/ice with a Bunsen burner. Temperature is recorded every 30...
Curated OER
Catching Some Rays
Sixth graders explore the tilt of Earth's axis. In this Earth lesson plan, 6th graders read a Greek mythology story explaining why there are seasons. Students build a sun-ray gathering tool from styrofoam, glue, thermometers, skewers,...
Curated OER
What Happened to the Mean and Median
Students find the mean, median and mode. In hs statistics lesson, students collect, plot and analyze data. The identify the effect the central tendency have on the data and line.
Curated OER
Visible Pulse
Learners record their pulse rate. In this circulatory system lesson, students use a piece of clay and a straw to make their pulse move visible and easier to accurately count and record.
Curated OER
I'm Inclined to See; Physics, Math, Science, Experiments, Graphs
Students discover the motion of a sphere on an inclined plane and discover basic relationships involving distance, time, speed(velocity), and acceleration.
Curated OER
Atlatl Lessons Grades 4-12: Lesson for Beginning Users of Atlatl
Sixth graders determine the mean, range median and mode of a set of numbers and display them. In this data lesson students form a set of data and use computer spreadsheet to display the information. They extend of the process by...
Curated OER
"M&Ms"® Candies Worksheet 1
In this math worksheet, students find the likelihood of different outcomes with the use of M and M's candy for the seven questions and fill in the graphic organizer.


