Curated OER
Data Collection
Students write a journal exercise that relates to pets. They collect information from each other in order to practice making and interpreting bar graphs. They Continue building different kinds of graphs with the group.
CPO Science
Physics Skill and Practice Worksheets
Stop wasting energy searching for physics resources, this comprehensive collection of worksheets has you covered. Starting with introductions to the scientific method, dimensional analysis, and graphing data, these skills practice...
Curated OER
Real Misleading Graphs
Students identify real graphs and misleading graphs. In this algebra lesson, students surf the Internet for real life scenarios where graphs are used in a misleading way as well as in a correct way.
Curated OER
Graphing Difference
Students use problem solving skills to reason, predict and problem solve through exploration. They recognize a way in which they are different from their peers and create a graph that shows these differences.
Curated OER
Organizing Data
For this organizing data worksheet, 7th graders solve seven different types of problems related to data. They first identify the type of data as categorical, discrete or continuous from the information given. Then, students use Excel to...
Curated OER
Charts and Graphs
Fifth graders interpret data into graphs and percentages. In this organizing data lesson, 5th graders discuss bar, circle and line graphs. Students complete bar graph and apply probability using the results.
Curated OER
Understanding Statistics
In this statistics worksheet, students examine and interpret pictographs and line graphs. Students analyze the provided data in order to create bar graphs, circle graphs, and box and whisker plots. The nine page worksheet accompanies a...
Curated OER
Graphs Review
Seventh graders review different types of graphs such as bar graphs, line graphs, box & whisker plots. As a class, they read a story and construct graphs to solve the data in the story. Students play "Graph Jeopardy" which requires...
Curated OER
Line 'Em Up!
Learners find coordinate points on a grid and create a line graph with those points. This lesson should ideally be used during a unit on various types of graphs. They make and use coordinate systems to specify locations and to describe...
Curated OER
Energy Worksheet #1
A graph of Earth's average monthly temperatures from 1990 to 1994 is posted across the top of the page for meteorology masters to analyze. Five multiple choice questions are asked regarding temperature variation. This does not have to be...
Curated OER
An "Average" Golf Score
Ninth graders investigate mean, median, and mode. In this mean, median, and mode lesson, 9th graders research gold data for the top ten scores in two golf tournaments. Students make tables and graphs of the data. ...
Curated OER
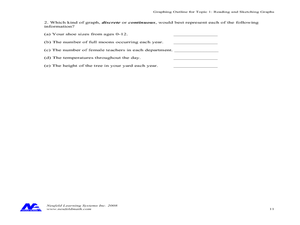
Reading and Sketching Graphs
In this graphs worksheet, students answer 15 multistep questions about graphs. Students determine distance traveled, time, velocity, and create scenarios to fit the graph.
Wordpress
Introduction to Exponential Functions
This lesson plan begins with a review of linear functions and segues nicely over its fifteen examples and problems into a deep study of exponential functions. Linear and exponential growth are compared in an investment task. Data tables...
Illustrative Mathematics
Proportional Relationships, Lines, and Linear Equations
The resource is a good introduction to what makes a proportional relationship between two lines. Discuss the similarities of both lines and the possibility of intersection. Use this opportunity to list other acceptable forms of each...
EngageNY
Graphs of Piecewise Linear Functions
Everybody loves video day! Grab your class's attention with this well-designed and engaging resource about graphing. The video introduces a scenario that will be graphed with a piecewise function, then makes a connection to domain...
EngageNY
Making Scale Drawings Using the Parallel Method
How many ways can you create a dilation? Many! Individuals strengthen their understanding of dilations by using various methods to create them. The new technique builds on pupils' understanding of the ratio method. Using the ratio,...
Curated OER
Scatter-Brained
Seventh graders graph ordered pairs on a coordinate plane. They create a scatterplot. Additionally, they determine the line of best fit and investigate the slope of the line. Multiple resources are provided. An excellent resource!
Curated OER
Walking the Plank
This is a cool math activity. Kids collect and interpret data based on a physical act. A board is balanced between a scale and a step, learners record a peer's weight as it decreases while s/he walks further away from the scale. They...
Curated OER
Regents High School Examination: Living Environment 2005
The 2005 version of the Regents High School Examination in the area of ecology is as comprehensive as previous years' exams. It consists of 40 multiple choice questions on everything from the structure of DNA to the interactions within...
Curated OER
Regents High School Exam: Living Environment 2008
Tne New York Regents High School Examinations are comprehensive and include various styles of questions, includingmultiple choice and the analysis of graphs. This particular version, the 2008 Living Environment exam surveys a variety of...
Curated OER
Regents High School Examination: Living Environment 2009
Emerging ecologists need a full understanding of life, from the inner workings of a cell to the complex relationships among organisms. This examination is meant to assess high schoolers after an entire year course on the living...
Curated OER
Activity Plan 4-5: I'm Graphing to Know You!
Students create graphs about themselves to learn more about one another. In this early childhood math lesson, students record information about one another as they make picture graphs.
Curated OER
Human Population Growth
In this human population growth worksheet, students create a graph of human population growth and predict future growth using the data given in a chart. Students identify factors that affect population growth.
Curated OER
Integrated Algebra Practice: Frequency Histograms, Bar Graphs and Tables
In this graphs worksheet, students solve 4 problems about histograms, bar graphs, and tables. Students answer questions about histograms, bar graphs, and tables.


