101 Questions
Snow Day
Who doesn't like a snow day? Learners watch a snow accumulation over a span of 10 hours. They use that information to make a prediction of the total snow that fell during the 23-hour snowfall. Will it be enough to cancel school?
Curated OER
When Will We Ever Use This? Predicting Using Graphs
Here are a set of graphing lessons that have a real-world business focus. Math skills include creating a scatter plot or line graph, fitting a line to a scatter plot, and making predictions. These lessons are aimed at an algebra 1...
Curated OER
Math in the Wetlands Field Trip
Get your class out in the environment for hands on math activities. For this wetlands lesson, learners transplant native plants, calculate how much soil is needed, and perform math activities based on this experience. They then make...
American Statistical Association
Scatter It! (Using Census Results to Help Predict Melissa’s Height)
Pupils use the provided census data to guess the future height of a child. They organize and plot the data, solve for the line of best fit, and determine the likely height and range for a specific age.
Curated OER
Reading Comprehension 1: Level 11
Here’s a reading comprehension assessment that will capture the interest of your learners. Stink bugs and the danger they pose to farmers is the subject of the passage, while the eight questions ask readers to infer, predict, summarize...
Curated OER
Sea Turtle Math
Middle schoolers consider the future of endangered species. In this conservation lesson, students view a slide show and use mathematical data to construct a prediction for the survival of an endangered species. This lesson includes,...
Curated OER
Make Ten Bundles
How many rolls until you get to 100? Young mathematicians will have a blast with this place value game, which has them rolling a die and placing a corresponding number of popsicle sticks in the "ones" column of their mat. Once they get...
Curated OER
Applied Science - Science and Math Lab
Students make a prediction. In this applied science instructional activity, students guess the number of items in a jar. Students create a bar graph to show the predictions and the actual amounts.
Curated OER
Mistletoes Math Investigation
This math investigation has kids consider the branch growth of a Mistletoe tree. They use imput tables to determine branch growth per year. Cool way to warm up when it's cold outside.
EngageNY
Modeling Relationships with a Line
What linear equation will fit this data, and how close is it? Through discussion and partner work, young mathematicians learn the procedure to determine a regression line in order to make predictions from the data.
Virginia Department of Education
Quadratic Curve of Best Fit
Class members create a table of the number of chords that can be drawn given the number of points on a circle. Pupils analyze the data created, find a function to fit to it, and use the function to make further predictions.
EngageNY
Calculating Conditional Probabilities and Evaluating Independence Using Two-Way Tables (part 2)
Without data, all you are is another person with an opinion. Show learners the power of statistics and probability in making conclusions and predictions. Using two-way frequency tables, learners determine independence by analyzing...
EngageNY
Normal Distributions (part 2)
From z-scores to probability. Learners put together the concepts from the previous lessons to determine the probability of a given range of outcomes. They make predictions and interpret them in the context of the problem.
Charleston School District
The Line of Best Fit
If it's warm, they will come! Learners find a line of best fit to show a relationship between temperature and beach visitors. Previous lessons in the series showed pupils how to create and find associations in scatter plots. Now,...
101 Questions
Thanksgiving Taters
What would a meal be without the taters? The question is, how long does it take to peel those potatoes? Given the rate of peeling one potato, scholars predict the time it takes to peel the bag. The twist is that the first potato was...
EngageNY
Interpreting Residuals from a Line
What does an animal's gestation period have to do with its longevity? Use residuals to determine the prediction errors based upon a least-square regression line. This second lesson on residuals shows how to use residuals to create a...
Curated OER
Twelve Days of Christmas--Prediction, Estimation, Addition, Table and Chart
Scholars explore graphing. They will listen to and sing "The Twelve Days of Christmas" and estimate how many gifts were mentioned in the song. Then complete a data chart representing each gift given in the song. They also construct...
Radford University
Modeling the Number of Starbucks Stores
Drink your coffee, then marvel over the rise of Starbucks. Scholars use provided data on the number of Starbucks stores from 1987 through 2014 to create scatter plots. They then determine the equation for the curve that best fits the...
101 Questions
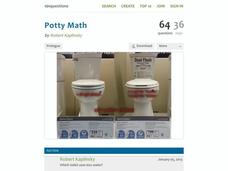
Potty Math
You don't want to flush your money down the drain! Have your classes complete a financial comparison between two different types of toilets. They use linear modeling to determine the most cost-effective model.
National Security Agency
It's Probably Probable
Learners make predictions and draw conclusions from given information as they learn the meaning of probability in this vocabulary-rich, integrated activity that presents a variety of teaching strategies to motivate and reach...
Mixing In Math
Mixing in Math: Growing Plants
Whether you have your class plant seeds or begin when sprouts are visible, math skills are used here to predict and track growth over time. Straw bar graphs show plant height on a given day while the graph as a whole shows changes over...
Curated OER
Toothpick Patterns
In this patterning worksheet, students identify and complete 15 different patterns that include using toothpicks. First, they determine the number of toothpicks needed to create each figure in a given sequence. Then, students determine...
Curated OER
Making Benchmarks - Mass
Elementary schoolers predict the mass for different objects. Then, using objects of 1kg mass, they make a more precise prediction. Afterwards, they discuss the need for having and using standard measures of mass.
EngageNY
Informally Fitting a Line
Discover how trend lines can be useful in understanding relationships between variables with a lesson that covers how to informally fit a trend line to model a relationship given in a scatter plot. Scholars use the trend line to make...
Other popular searches
- Making Predictions Math
- Math Predictions
- Pumpkin Math Predictions
- Prediction Math
- Prediction Skills in Math
- Tsunami Prediction Math


