Curated OER
Watts Up Doc?
Students examine the wattage of a light bulb using math. In this algebra instructional activity, students find the inverse square of given parameter. They work in groups collecting and analyzing data.
Curated OER
Arithmetic Chains
Students complete a chain of numbers given the outcome. In this geometry lesson, student use deductive and inductive reasoning to solve problems. They create a formula and ways to predict numbers in the chain without starting over.
Curated OER
Chew on This
Eighth graders explore and demonstrate the seven steps of the scientific method. They predict how much sugar is in chewing gum and test, analyze, and calculate the sugar content of gum.
Curated OER
Statistics and Shopping
Young scholars explore the concept of using consumer data and statistics to aid in the consumer decision making process. In this consumer data and statistics lesson, students research consumer data and statistics. Young scholars...
Curated OER
Fun With Sound
Second graders make predictions. In this sound lesson, 2nd graders listen to various sounds, and write down and draw what they think that sound is. Students make a chart of their predictions.
Curated OER
Comparison of Two Different Gender Sports Teams - Part 3 of 3 Scatter Plots and Lines of Best Fit
Pupils create a scatter plot for bivariate data and find the trend line to describe the correlation for the sports teams. In this scatter plot instructional activity, students analyze data, make predictions,and use observations...
Curated OER
Let's Take a Chance!
Students investigate probability and the chance of an even happening. In this algebra lesson, students incorporate their knowledge of probability to solve problems and relate it to the real world. They learn to make decisions based on data.
Curated OER
Data Analysis, Probability, and Discrete Mathematics: Lesson 4
Eighth graders investigate the concepts of probability while performing data analysis. They apply statistical methods in order to measure or predict some possible outcomes. The information is collected and graphed, 8th graders analyze...
Curated OER
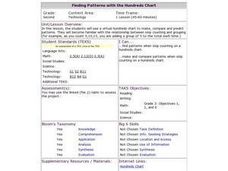
Finding Patterns with the Hundreds Chart
Students review their numbers up to one hundred. Using a chart, they compare and predict patterns that might be in the numbers. They practice skip counting and grouping numbers. Using a spreadsheet, they graph different sets of numbers...
Curated OER
Getting A Grip On Graphs
Fourth graders investigate the concept of graphing and comparing different types of data using pictographs, line graphs, scatter plots, etc... They gather data and make interpretations while examining the medium of how it is displayed.
Curated OER
Wrapped Up In A Kiss!
Students use the wrapper of a Hershey's Kiss to practice estimating, predicting and measuring. They measure with centimeter rulers.
Curated OER
The Stock Market Game
Students explore the stock market. They choose a company and research the company's financial report. Students select 4-10 stocks and become an advocate for one stock. Using spreadsheet software, students compare stocks. They analyze...
Curated OER
"Socrates and the Three Little Pigs" by Mitsumasa Anno
Learners gain an understanding of probability and make reasonable estimations.
Curated OER
Do Different Colors Absorb Heat Better?
Students work together to test how the color of a material affects how much heat it absorbs. They make predictions and take notes on their observations. They discover how engineers use this type of information.
Curated OER
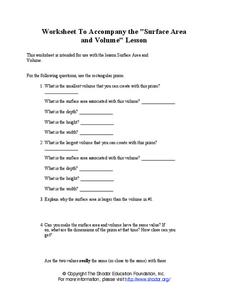
Surface Area and Volume
Accompanying the lesson at www.shodor.org, this worksheet present students with a series of questions about the volume and surface area of a rectangular prism and a triangular prism. Students predict how these values would change if the...
Curated OER
Fire!, Probability, and Chaos
Students explore the concept of probability. In this probability lesson, students simulate a controlled forest burn using an applet. Students vary the probability of trees burning and predict what will happen.
Curated OER
Guided Reading Lesson: Here Comes the Bus
Learners discover basic concepts of print. In this early literacy lesson, students discover basic high frequency words. Learners make predictions as they read. Cross-curricular activities provided.
Curated OER
Scale Me Down
Students create scale drawings, and ultimately scale models, of real-world objects in this Math lesson about ratios, proportion, scaling factors, and cross products. The lesson includes ideas for cross-curricular extensions and is...
Curated OER
Counting on Measurement
First graders explore measurement. They measure by counting non-standard units. Students use a variety of non-standard units to predict and measure volume of various containers using rice.
Curated OER
Does Weight Affect Drag?
Students investigate how weight affects a parachute's rate of fall. In this investigative lesson students test parachutes, average results and conclude what makes a faster descent.
Curated OER
100 Stamps for 100 Days
Students recognize similarities and generalize patterns. In this math and technology lesson plan, students develop an understanding of number patterning by grouping stamps and counting by 10s.
Curated OER
Bar Graph Lesson
Students make a bar graph. In this graphing lesson, students discuss why bar graphs are used and are shown bar graph examples. Students create their own bar graph to compare the heights of different things around the world. Students...
Alabama Learning Exchange
Showing the Difference between Erosion and Weathering
Learners explore the concepts of weathering and erosion. After viewing pictures of both erosion and weathering, students work in pairs to conduct an experiment with sugar cubes, water, sand, and a straw. They write their predictions and...
Curated OER
Similarity and Congruence
Students explore the concept of similarity and congruence. In this similarity and congruence lesson, students cut out strips of paper and form a triangle. Students try to prove that their triangles are congruent using the SSS theorem of...
Other popular searches
- Making Predictions Math
- Math Predictions
- Pumpkin Math Predictions
- Prediction Math
- Prediction Skills in Math
- Tsunami Prediction Math


