Curated OER
Painting a Color Wheel
You have to love the color wheel, it's just so colorful! Your kids will love it too, as they work through an introductory exercise which allows them the opportunity to draw and paint a color wheel of their own. This wheel focuses on...
K12 Reader
The Spy Will Try Not to Cry
Learn all about the exploits of a sly spy from the short poem included on this resource. The poem, intended to provide practice with long /i/ words that use the letter y, is paired with three reading comprehension questions for pupils to...
EngageNY
Solution Sets to Inequalities with Two Variables
What better way to learn graphing inequalities than through discovering your own method! Class members use a discovery approach to finding solutions to inequalities by following steps that lead them through the process and even include...
Curated OER
Graphing Systems of Inequalities
Solve equations and graph systems of inequalities. Designed as a instructional activity to reinforce these concepts, learners revisit shading and boundaries along with solving linear inequalities.
Curated OER
Tiling the Classroom
Students see how to identify regular polygons, how to slide, turn and flip polygons, and why certain polygons tessellate better than others. Groups create a one foot square design to be used to tile the classroom. Great lesson!
EngageNY
Lines That Pass Through Regions
Good things happen when algebra and geometry get together! Continue the exploration of coordinate geometry in the third lesson in the series. Pupils explore linear equations and describe the points of intersection with a given polygon as...
West Contra Costa Unified School District
Sneaking Up on Slope
Pupils determine the pattern in collinear points in order to determine the next point in a sequence. Using the definition of slope, they practice using the slope formula, and finish the activity with three different ways to determine the...
Inside Mathematics
Graphs (2006)
When told to describe a line, do your pupils list its color, length, and which side is high or low? Use a worksheet that engages scholars to properly label line graphs. It then requests two applied reasoning answers.
Curated OER
Flying High in Ohio
Her is a lesson using the Ohio State Quarter. Pupils utilize beautifully-designed worksheets embedded in the plan, to study about the origins of aviation. Many of the pioneers of aviation were born in Ohio. They compare some of the...
Curated OER
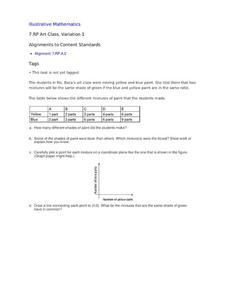
Art Class, Variation 1
Student statisticians calculate ratios to determine how many shades of green were mixed by Ms. Baca's art class. They graph the number of blue parts against the number of yellow parts for each combination and discover that some produce...
Curated OER
Supplementary, Complementary, and Vertical Angles
By using circles that they cut out and label themselves, learners literally "get a grip" on the angles they identify: supplementary, complementary, and vertical. They solve missing measurements based on properties of supplementary,...
Inside Mathematics
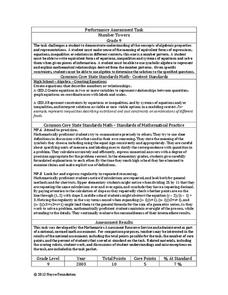
Number Towers
Number towers use addition or multiplication to ensure each level is equal. While this is common in factoring, it is often not used with algebraic equations. Solving these six questions relies on problem solving skills and being able to...
Cornell University
Catapults
Ready, aim, fire! Launch to a new level of understanding as scholars build and test their own catapults. Learners explore lever design and how adjusting the fulcrum changes the outcome.
Curated OER
A Moving Experience - Forces and Inertia
Students consider the first part of Newton's First Law of Motion, the Law of Inertia of objects at rest, which states that every object remains at rest unless acted on by a force. They perform hands-on experiments which demonstrate this...
Curated OER
Slope-Intercept Form of a Line
Using the subscriber website Explorelearning.com, young mathematicians observe changes in the slope and y-intercept and their effect on the graph of lines. This activity helps students develop an intuitive sense of the connection between...
Dick Blick Art Materials
“Rhythm in Layers”
Young artists learn to build rhythm into a design by repeating colors, shapes, and patterns in a 3-D sculpture activity.
EngageNY
Are All Parabolas Congruent?
Augment a unit on parabolas with an instructive math activity. Pupils graph parabolas by examining the relationship between the focus and directrix.
EngageNY
The Line Joining Two Distinct Points of the Graph y=mx+b Has Slope m
Investigate the relationship between the slope-intercept form and the slope of the graph. The lesson plan leads an investigation of the slope-intercept equation of a line and its slope. Pupils realize the slope is the same as the...
American Museum of Natural History
Bio-Benefits
Kick-start a discussion of the importance of biodiversity with a colorful resource that touts the benefits of maintaining healthy ecosystems. The images stress the interdependence of all the elements of an ecosystem.
Curated OER
Perimeter All Around
Students explore perimeter and area of regular and irregular polygons. They experiment with color squares and create different arrangements using the same number squares. Then they compare the area and perimeter measurements of each.
Curated OER
Geometric Figures-Triangles
Fourth graders explore triangles. In this math lesson plan, 4th graders discuss the different types of triangles. Students create triangles using wiki sticks. Students complete an online matching game.
Exploratorium
Bone Stress
Lighten up a bit with this activity! Use an old-fashioned overhead projector to shine light through a pair of polarizing filters. Place a stressed plastic object in between and display the colors of light waves revealed! Rotate the...
Curated OER
Orienteering - The Fundamentals
Students investigate the concept of a compass and it has been used in the past and in modern times. They practice using it in the wilderness in order to test its importance in various exploring activities. Each activity is accompanied by...
Curated OER
Lines, Lines, Everywhere
Students explore linear equation suing real life scenarios. In this algebra lesson plan, students find the slope and intercept of a line. They create table of values to plot their graph and draw conclusions.


