Curated OER
Taking Poll Information
Students investigate the election and poll surveys. In this statistics lesson, students take poll information and analyze the data. They graph their data and make predictions and conjectures.
Curated OER
Facing Life's Challenges
Students analyze divination and carry out experiments using a probability model. In this probability instructional activity, students review information about divination and predictions in various cultures. Students set up experiments to...
Curated OER
The Swinging Pendulum
Students observe a pendulum and graph their observation. In this algebra instructional activity, students use the TI calcualtor to graph the motion the pendulum makes. They analyze the graph and make predictions.
Curated OER
Triangle Inequality Theorem
Students identify properties of triangles. In this geometry lesson, students create triangles using three different segments. They make conjectures and predictions.
Curated OER
A Study of a Quadratic Function
Students factor and solve quadratic equations. In this algebra lesson, students play a game as the collect and graph data. they identify properties of their parabola and make predictions.
Curated OER
Percentiles
Students analyze the bell curve and make predictions. In this statistics lesson plan, students calculate the percentile to the left of the curve. They then are given the percentile and create the graph from the data.
Curated OER
Possible Outcomes 7
In this math worksheet, 6th graders make predictions about the possible outcomes for two word problems and correlate the data found in the graphic organizer.
Curated OER
Transformers
Students use transformation to move the graph around. In this geometry lesson plan, students observe transformation of symmetry groups. They use the TI to move the sides of the polygons around and make predictions.
Curated OER
Cell Phone Plans
Students relate the use of a cell phone to math. In this algebra lesson, students collect data on the usage of their phones and plot it. They analyze the graph and make predictions based on the rate per minute.
Curated OER
Factoring Trinomials
Learners factor trinomials using patterns and their TI to graph their results and make predictions through this lesson. This is accomplished by solving quadratic equations through FOIL and algebra tiles.
Curated OER
Graphs Galore
Fourth graders conduct surveys to collect data. They analyze and interpret the data, then determine which type of graph is appropriate for the data. Students use the data to make predictions, discover patterns and draw conclusions...
Curated OER
By Golly, By Gum
Young scholars investigate the ingredients and creation of chewing gum. In this scientific method lesson plan, students make predictions about what will happen to the mass of a piece of gum as it is chewed by a human. Young...
Curated OER
Regressive Music
Student use the Ti calculator to graph sinusoidal graphs. In this calculus lesson, students use the CBL to collect and analyze data of sinusoidal graphs. They manipulate their collected data and make predictions.
Curated OER
Line of Best Fit
Students calculate the equation of the line of best fit. In this statistics lesson, students create scatter plots and find the line of best fit going through their data. They make predictions and draw conclusions.
Curated OER
Probability and Statistics
Students are taught to search the internet for statistics concepts on sports. In this probability instructional activity, students collect data and use the calculator to graph and analyze their data. They graph and make predictions about...
Curated OER
M & Ms in a Bag
Students make predictions about the number and colors of M&M's in a snack size package. They create an Excel spreadsheet to record the data from their small group's bag, create a graph of the data, and discuss the variations of data...
Curated OER
Lake Ice Out Lessons
Students explore the greenhouse effect. In this environment lesson, students describe how "ice out" affects animals and plants who live in a Maine lake. Students graph "ice out" data and make predictions about the upcoming...
Curated OER
Designing a Speedometer
In this algebra worksheet, students analyze the designs of a speedometer. They collect data on the distance and time as the speedometer works. They draw conclusion and make predictions from the collected data. There are 4 word problems.
Curated OER
Counting Principle
Students identify the different outcomes given a situation. For this algebra lesson, students calculate the possible outcome using the counting principle. They compare and analyze patterns to make their predictions.
Curated OER
Data Analysis & Probability
Pupils make predictions based on survey results. They calcuate sample proportions. Students estimate the number of voters in their district preferring the democratic candidate using their sample results. They review sample proportions...
Curated OER
Data Analysis Using Technology
Analyze data using technology. Middle schoolers design data investigations, describe data, and draw their own conclusions. Then they select the best type of graph, graph and interpret the data, and look for patterns in trends. They also...
Curated OER
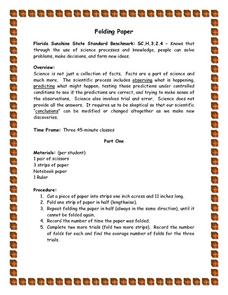
Folding Paper
Students use the scientific process and their knowledge to obeserve, predict, and test their predictions under controlled conditions to verify their predictions and then make sense of these predictions. They also graph, write...
Curated OER
Creating a Thematic Map Using S'COOL Data
Students observe weather patterns, collect data, and make a weather predictions for various locations on a map.
Curated OER
Math: Reaching New Heights
Pupils apply math skills to assess the range, mean, mode, and median of data sets. Using a "Reaching New Heights" worksheet, they review and discuss how to calculate the answers. Students write complete explanations of all their...
Other popular searches
- Math Predictions
- Pumpkin Math Predictions
- Making Math Predictions
- Tsunami Prediction Math
- Mathematical Predictions


