EngageNY
Analyzing Residuals (Part 2)
Learn about patterns in residual plots with an informative math lesson. Two examples make connections between the appearance of a residual plot and whether a linear model is the best model apparent. The problem set and exit ticket...
Illustrative Mathematics
Multiples of 3, 6, and 7
What are the common multiples of three, six, and seven? Assess young mathematicians ability to find the common multiples of three numbers in a straightforward math task.
West Contra Costa Unified School District
Connecting Graphing and Solving Absolute Value Equations and Functions
Can you solve an equation graphically? Absolutely! This Algebra II lesson makes the connection between solving an absolute value equation and graphing two functions. Graphing absolute value functions is presented through the process of...
EngageNY
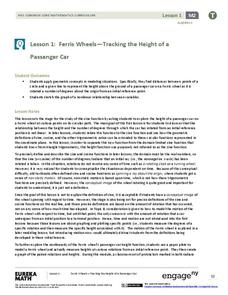
Ferris Wheels—Tracking the Height of a Passenger Car
Watch your pupils go round and round as they explore periodic behavior. Learners graph the height of a Ferris wheel over time. They repeat the process with Ferris wheels of different diameters.
EngageNY
Modeling Riverbeds with Polynomials (part 2)
Examine the power of technology while modeling with polynomial functions. Using the website wolfram alpha, learners develop a polynomial function to model the shape of a riverbed. Ultimately, they determine the flow rate through the river.
US Department of Commerce
Census in Counties - Describing and Comparing Histograms to Understand American Life
Use graphs to interpret life in 136 counties. Pupils analyze histograms and describe the shapes of the distributions of data collected from several counties on different aspects of life. Scholars make predictions on the difference in...
Virginia Department of Education
Attributes of a Rectangular Prism
A change is coming. Pupils use unit cubes to investigate how changes in the length, width, and/or height affects volume and surface area. They extend the results to write and test predictions on the effect of changing multiple sides on...
Curated OER
Investigations into Estimations
Learners gain the powerful tools of estimation, prediction, and averaging and discover the importance these tools have in daily living.
Curated OER
Deductiva Deductions (Deductive Reasoning)
Third graders apply deductive reasoning and make predictions. In this language arts lesson, 3rd graders discuss questions and use deductive reasoning to make a prediction. Students look for patterns and prior knowledge to make predictions.
Curated OER
Jellybean Graphs
Second graders predict and graph data based on the color of jelly beans they think are in a handful. In this prediction lesson plan, 2nd graders will predict how many of each color jellybean are in a handful. Then they graph these...
Curated OER
Magnets and Interactions
Second graders discover what magnets can do. In this magnet lesson students make predictions about magnets. They experiment with the magnets and record their data on a chart.
Curated OER
Fall Leaves Fall! Lesson Plan
Students discover facts about leaves. In this early childhood lesson plan, students identify different types of leaves, and make predictions about which types of leaves they think they will find in their community. Students collect...
Curated OER
Probability with Number Cubes
Second graders make sampling predictions, predict outcomes and explore probability through experimentation.
Curated OER
Using Extrapolations
In this using extrapolations worksheet, 6th graders use data analysis to answer nine questions about data prediction and extrapolation.
Curated OER
It Started as an Egg
Learners investigate animals that hatch from eggs. In this hatching animals lesson plan, students investigate which animals are born alive and which hatch from eggs. Learners read It Started As An Egg and practice reading comprehension...
Curated OER
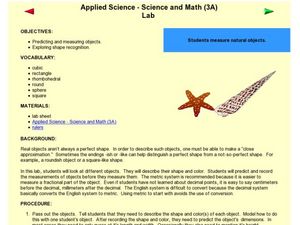
Measuring Natural Objects
Students predict the measurement of objects. For this measurement lesson, students estimate the measurements of objects in a lab. Students measure irregular objects and generate scientific observations.
Curated OER
Candy is Dandy
Students investigate color distribution in bags of M&Ms They sort and classify the contents of a bag of M&Ms and summarize their findings on a worksheet. Students convert the numbers into charts and make predictions about color...
Curated OER
Shape Pattern Prediction
In this pattern and sequence worksheet, students analyze the series of six shapes and from two choices, circle and color the shape that continues the pattern. There are 12 problems.
Curated OER
Do You Feel Lucky?
Students calculate simple probabilities using mathematics then roll dice to test their predictions.
Curated OER
The Cause & Effect Model
Students analyze the plot of the story, "The Little Engine That Could" to provide a model for writing creatively, developing critical essays, producing themes, and making predictions.
Curated OER
Advanced Algebra: Do You Feel Lucky?
Young scholars explore the realm of mathematical probability while playing a game of chance. after constructing paper rockets, they fire it enough times to determine the probabilities of the rocket traveling past a marked distance and...
Texas Instruments
Finding Linear Models Part III
Explore linear functions! In this Algebra I lesson, mathematicians graph data in a scatter plot and use a graphing calculator to find a linear regression and/or a median-median line. They use the model to make predictions.
Curated OER
Collecting Data to Learn About the People Around You
Human graphs, anyone? Did you eat fruit today? What is your favorite costume? Have your K – 6 learners graph the responses. Early elementary grades may count and compare while upper grades compare responses of different groups or make...
PBL Pathways
College Costs
Predict the year that college costs will double in your state using linear modeling. The first part of this two-part project based learning activity asks young mathematicians to use data from the College Board. They graph the data,...
Other popular searches
- Math Predictions
- Pumpkin Math Predictions
- Making Math Predictions
- Tsunami Prediction Math
- Mathematical Predictions


