Curated OER
Introduction to Functions
Learners explore functions, function rules, and data tables. They explore terms of linear functions. Students use computers to analyze the functions. Learners write short sentences to explain data tables and simple algebraic expressions.
Curated OER
Edible Geometry
Young scholars examine a chart that lists the main characteristics of polygons and 3 dimensional figures. They make examples of the polygons and figures using pretzels and gum drops showing how the gum drops are vertices and the pretzels...
Curated OER
Probability and Geometry
Students explore the ways Geometry can help solve probability problems. Students describe platonic solids and practice calculating probability using an online resource. They construct dice with various numbers of sides to demonstrate...
Curated OER
Scatter Plots
In this Algebra I/Geometry/Algebra II worksheet, learners create a scatter plot and analyze the data to determine if the data show any type of correlation. The four page worksheet provides extensive explanation of topic, step-by-step...
Curated OER
Coin Conversions
Fifth graders engage in the study of conversions from decimals to percents while examining monetary values. They explain the relationships between the equivalency interchanging decimals with percents. Then students write about the...
Curated OER
The Baby Boom -- How Do We Know it is a Boom?
Students examine graphs of three statistics and use basic math to compute their own. They evaluate the implications of manipulating data and whether statistics are appropriate for creating policy.
Curated OER
Using inverse Operations to Solve Equations
Fifth graders solve equations. In this algebraic equations lesson plan, 5th graders use the inverse operation to solve an equation. The teacher reminds students to perform the operation on both sides of the equation. This lesson plan...
Curated OER
The Probability Dilemma
Ninth graders investigate patterns. In this first through second grade mathematics lesson, 9th graders read Bat Jamboree and create a pictorial representation of a bat pyramid. Students use the manipulative pyramid to explore...
Curated OER
Growing, Growing, Gone
Budding mathematicians identify growing patterns in numbers and songs then create their own patterns. They look at number patterns and language patterns and then create their own using money and footprints.
Curated OER
Quilting Geometry
Study geometry through the concept of quilt design. High schoolers examine the geometric shapes in various quilts and then create their own quilts using geometric shapes that fit together. In the end, they write a paragraph to describe...
Curated OER
Interactive Fractions
Young scholars determine the common denominator of two unlike fractions. They practice adding fractions and finding equivalent fractions of numbers. They compare and contrast different types of equations involving fractions and construct...
Curated OER
Adding Fractions with Unlike Denominators
Students explore why denominators need to match before adding (or subtracting) a fraction. They use unmarked fraction circles and marked fraction bars, to discover a method to add fractions with unlike denominators using equivalent...
Curated OER
Equivalent Fractions
If you are looking for a simple way to review equivalent fractions, this is a great resource. Using a visual means and a series of examples, learners review this skill. There is a worksheet provided and a prompt to encourage pupils to...
Curated OER
Multiplying with Egg O
Third graders multiply whole numbers by one and two digit numbers using base ten blocks and Egg O multiplication game. students pass out egg cartons, counters, and a record sheet to each group.
Curated OER
Connecting Formulas Related to Geometric Figures
Students identify diagrams of quadrilaterals and circles by different names and classify the figures. They name the areas for each diagram and practice solving the formulas for each.
Curated OER
Lining Up the Cars
Students review how to count the total amount of arrangements using multiplication. Using a computer, they determine the amount of cars needed for a parade in their local community to move the town's officials. They identify any patterns...
Curated OER
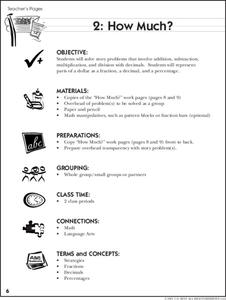
How Much?
It's time to go back over all that your class has learned about decimals, fractions, and percentages! To do so, individuals solve story problems that involve addition, subtraction, multiplication, and division with decimals, explain how...
Curated OER
Shapes from Shapes
Geometric shapes are really cool. Examine triangles, quadrilaterals, trapezoids, rhombuses, parallelograms, pentagons, and hexagons with your class. They draw large shapes and small shapes then compare them to understand their shapely...
Pennsylvania Department of Education
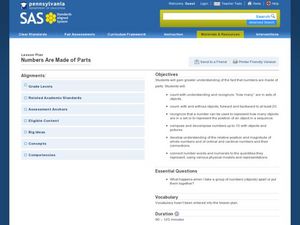
Numbers Are Made of Parts
Children play with barnyard animal cards to practice composing and decomposing numbers. With their "secret number" of animal cards in a cup, they shake and spill them onto a barn story board, counting how many animals fall in the barn...
Robert Gordon University
Indices
The laws of exponents are written on a handy reference sheet. Note that since this worksheet was written in the UK, powers or exponents are also called indices (singular: index). If this does not pose a problem for you, the concepts and...
Curated OER
The Tortoise And The Hare
Students use the children's story of The Tortoise And The Hare in order to investigate the graphing of equations. The story is converted to an algebraic word problem for them to solve. Students investigate the relationships of data and...
Curated OER
Do You Know Your Schedule?
Students identify classes in their schedules and associate the class with the time of day it is held. They then name classes in sequential order according to the period during which it occurs.
Curated OER
The Pythagorean Theorem
Students research Pythagoras and learn how to apply his theorem. They solve real life problems using the theorem and demonstrate knowledge of exponents, equations, and radicals. Students include diagrams in their research papers.
Curated OER
Sweet Data
Young scholars input data about the colors of their serving of M&M candies onto a spreadsheet. They create charts and graphs based on this information.


