Science Matters
Finding the Epicenter
The epicenter is the point on the ground above the initial point of rupture. The 10th lesson in a series of 20 encourages scholars to learn to triangulate the epicenter of an earthquake based on the arrival times of p waves and s...
Curated OER
Exploring the Sky: Reading Maria's Comet
Discover the science behind astronomy. After reading the book Maria's Comet, which is about a young woman who breaks new ground by becoming a female astronomer, young learners practice reading comprehension with...
Curated OER
Mapping Districts
Students become literate in their use of maps. In this 2010 Census lesson plan, students visualize census data on maps, use map keys to read population maps, and explore the concept of population density.
Curated OER
Honey Bee Facts And Figures: Math Skills
Students practice their mathematics and mapping skills using examples from honey bee biology. Discuss why the colonies were found in this pattern. They examine food and water in the area, and how many humans live in the area where...
Curated OER
Mapping and Excavating a Jello Mold
Fifth graders, in groups, map the three layers of different colored jello layers in molds and note the placement of fruit in them. On the grid paper they draw each grape, raisin, or other object and carefully remove each layer. After...
Curated OER
Isolines on a Weather Map
Ninth graders explore weather by analyzing maps. For this temperature lesson, 9th graders view black and white weather maps of locations in which the weather changes often. Students identify the isolines used on the maps and utilize the...
Curated OER
Introduction to Topographic Maps
Tenth graders create a topographic map and see how it represents different elevations. In this topographic maps lesson plan students read and interpret topographic maps.
Curated OER
AP Exam Rubrics/ Four Color Theorem
Twelfth graders review free response questions that are present on the AP exam. In this calculus lesson, 12th graders analyze the 4 color theorem that proved 4 colors were enough to color a map while still separating adjacent countries....
Curated OER
Magic Math Work
In this magic math work worksheet, students follow the steps for 2 math puzzles where they pick a number, and perform some computations with it.
Curated OER
Create a Country
Students work in small groups to list features and elements found on a variety of grade- appropriate maps. They develop a class list of map features and elements to draw from as they create a map of an imaginary country.
Curated OER
Creating a Map for Future Reference
Students use Web and other resources to create maps of either the site of their day trip, their final destination, the entire trip, or some combination of these.
Curated OER
Mapping Plate Boundaries
Students discover plate boundaries based on the uneven geographic occurrence of geologic hazards. After discussing geologic hazards, students plot different sets of earthquakes and volcanic eruptions on maps.
Curated OER
Cruisin' the Counties: Learning Counties and Major Roads in Arizona
Learners examine Arizona counties and use the themes of location and movement to develop an Arizona map.
Curated OER
Treasure Hunt: Coordinate Graphing
Two of the best words any one can hear– treasure hunt! Your class will be excited to practice graphing on a coordinate grraph as they identify and write coordinates for landmarks they see on a treasure map. They trace their route to the...
Curated OER
Foliage Tracker
Young scholars discuss the change of leaf colors and the role that climate and elevation play in those changes. They then track leaf changes, input data, and graph foliage changes with a free online tool.
Curated OER
CHARTING THE COURSE
Students uses atlases, maps, and Web resources to determine the distance, driving time, and amount of money they need to make the trip (estimates should include hotel/motel stays, meals, and souvenirs).
Curated OER
Colonial Vacation Planner
Students plan a family vacation to states that were among the original 13 colonies. The groups determine which state they visit, map their route, calculate the mileage, and determine how much money they spend on gasoline.
Curated OER
Go Bananas! (Lesson One)
Students research the historical and present movements of bananas. Using maps, they locate the countries in which the fruit is grown and identify common characteristics between the banana-growing countries. They also trace the movement...
Curated OER
Pictures of Data
In this data worksheet, students look at maps and charts and answer multiple choice questions about them. Students complete 10 questions.
Curated OER
Mapping the Circulatory System
Students investigate the circulatory system in human beings. In this human body instructional activity, students create an outline of a human body using colored markers and butcher paper. Students use red and blue colors to...
Curated OER
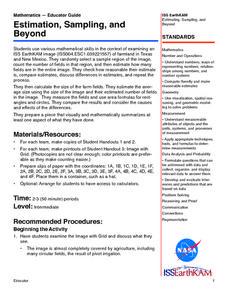
Estimation, Sampling, and Beyond
Students examine an ISS EarthKAM image of farm land in Texas and New Mexico. They select sample region of image and count the number of fields in that region. They estimate how many fields are in the entire region.
Curated OER
Election Results Map
Students use election night returns to create a map of the results. They can represent popular vote results or electoral votes received. They use the internet to gather information about the electoral college and results.
Curated OER
Mapping a Stream
Students map an actual local waterway. They create full color scale drawings that include windfalls, plant cover, streambed composition, and landmarks such as trees, boulders, and slumps. This is a long-term project that involves...
Curated OER
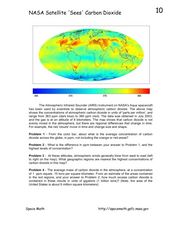
NASA Satellite 'Sees' Carbon Dioxide
In this atmospheric carbon dioxide worksheet, students observe a map showing the concentrations of atmospheric carbon dioxide taken by the Atmospheric Infrared Sounder instrument. Students solve 4 problems using the map. They determine...


