Curated OER
Introducing the Concept: Proportions
Students measure distances. In this proportions lesson, students use a map to find how far it is between different cities. Students use their knowledge of measurement, multiplication and fractions to find the distances.
Curated OER
Coordinate Grid: Mapping Archeological Sites
Fourth graders discover how to apply the Cartesian coordinate system by figuring out the length and width of their school playground. They determine that pacing is an important tool for the initial mapping of a site. Students conduct a...
Curated OER
Reading distance on maps
Eighth graders complete worksheets on reading the distance on maps in miles or kilometers. In this maps lesson plan, 8th graders use a calculator and ruler.
Curated OER
Mapping with a Compass: A Simulated Survey
Students use compasses and grids to map the locations of artifacts found in a simulated dig site. In groups, they role-play as future archeologists excavating a school site. Groups begin at their assigned datum and site the artifacts...
Curated OER
Playground Mapping
Students review their physical models of the objects on their playground at school. Using the model, they convert it into a map with a scale and key. To end the instructional activity, they use the map to locate different objects and...
Curated OER
Where Is Japan? How Far Is That?
First graders use literature and hands-on activities with maps and globes to explain distance and tools used to measure distance. They select tools to measure various objects in the classroom, then apply those concepts to their map...
Curated OER
Blazing the Trail
Learning about proportions through measuring and mapping distances is the focus of this real-world math instructional activity that doubles as an activity. Mathematicians complete a course designed to measure and map locations in order...
Curated OER
One Size Fits All?
Students describe the differences between an estimate and a guess. They create reasonable estimates based on comparison and activities. Students explain how estimation is helpful in showing the relative size on a scale. They also...
Mathematics Assessment Project
Comparing Strategies for Proportion Problems
Having problems with proportions? Then solve these proportion problems with an exercise that asks learners to first individually solve a set of problems involving ratios and proportional reasoning. Groups then discuss provided sample...
Mathematics Assessment Project
Evaluating Statements About Enlargements
Double, toil ,and double linear dimensions. Learners first complete an assessment investigating how doubling linear dimensions affects the area of pizzas and the volume of popcorn containers. They then complete an activity investigating...
Curated OER
Mapping India
Students participate in an activity in which they place placards listing geographic features, landmarks, etc. in the correct place on a large fabric map of a given country. They also examine artifacts, photos, sounds/music, etc. from...
Curated OER
Cartography
Young scholars research about cartography and how to be a cartographer. In this math lesson, students draw a map of their classroom. They use a robot to explore navigation using a compass rose.
Curated OER
Exploring Scale
Sixth graders discuss how the scale and type of graph can change how the data appears. With a partner, they identify all the information about the graph in a specific amount of time and record them in a journal. To end the lesson, they...
Curated OER
Scatter Plots
Seventh graders investigate how to make and set up a scatter plot. In this statistics activity, 7th graders collect data and plot it. They analyze their data and discuss their results.
Curated OER
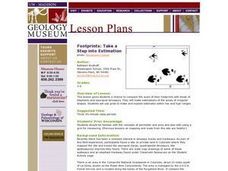
Footprints: Take a Step into Estimation
Compare sizes of student footprints with those of elephants and sauropod dinosaurs! Upper graders make estimations of the areas of irregular shapes; students use grids to make and explain estimates within low and high ranges.
Curated OER
ExplorA-Pond: 4th Grade Perimeter Estimation
Your geometers are used to finding the perimeter of a square or rectangle, so give them something different this time! With this lesson, small groups will receive a picture of a shoreline and calculate the perimeter. The website listed...
Curated OER
Cruisin' the Counties: Learning Counties and Major Roads in Arizona
Students examine Arizona counties and use the themes of location and movement to develop an Arizona map.
Curated OER
The Distance Formula and Marching Nonviolently for Social Change
Students explore the distance formula using real world data from nonviolent marches for social change. In this secondary mathematics lesson, students investigate the marches of Gandhi and King using maps overlaid with a coordinate...
Curated OER
Mathematics of Cartography
Students practice their math skills as they explore maps. In this cartography lesson, students calculate distance, scale, coordinate systems, and projection as they work independently reading online maps.
Curated OER
Congressional Travel
Students determine the distances traveled by the members of the legislative branch of the US Government. In this travel distance instructional activity, students locate Washington, DC on a globe using the longitude and latitude of the...
Curated OER
Mapping a Stream
Students map an actual local waterway. They create full color scale drawings that include windfalls, plant cover, streambed composition, and landmarks such as trees, boulders, and slumps. This is a long-term project that involves...
Curated OER
Home on the Range
Students use maps and mathematics to determine the appropriate panther population in a given area. In this Florida ecology lesson, students research the area requirements of male and female panther and use a map to help calculate how...
Curated OER
The Tale of Scale
Eighth graders, using a range of data, produce three bar graphs for various scales along the y-axis.
Curated OER
The Good, The Bad, The Ugly
Sixth graders examine the causes of the stock market crash of 1929. In this integrated math/history unit on the stock market, 6th graders study, research, and read stocks, visit a local bank, and create a PowerPoint to show the finished...


