Curated OER
Using Charts and Graphs to Study East Asia's Modern Economy
Students examine East Asia's modern economy. In groups, classmates use the internet to compare the resources, products, and economy of specified countries. After collecting the data, pupils create charts, tables and graphs. They...
Curated OER
Bias in Statistics
Students work to develop surveys and collect data. They display the data using circle graphs, histograms, box and whisker plots, and scatter plots. Students use multimedia tools to develop a visual presentation to display their data.
Curated OER
How the Environment Affects Our Health
Ninth graders explore how the environment affects health. In this infectious disease instructional activity, 9th graders investigate what environmental situations cause infections diseases. Students study the symptoms, treatments,...
Curated OER
Mapping River Statistics
Students research different statistics to do with the Mississippi River. They answer questions about finding data and collect it by conducting research. The research is used to construct a data table. Then students use the table to...
Curated OER
Mapping the Ocean Floor
Young scholars study the bottom structure of underwater habitats and how they can be mapped.
Virginia Department of Education
Functions 1
Scholars learn what it means for a relation to be a function and see various representations of functions. After learning the definition, they participate in a card sorting activity classifying relations as functions or not.
Curated OER
Exploring an Atlas
Students explore global geography by participating in an atlas activity. In this countries of the world instructional activity, students collaborate in small groups and analyze an atlas while researching continents, countries and...
Curated OER
A Research Project and Article For the Natural Inquirer
Get your class to use the scientific process to solve a scientific problem. They utilize the Natural Inquirer magazine to identify a research question which they write an introduction to and collect data to answer. They use graphs,...
Curated OER
Inference Lesson Plan
Students practice assessing graphics to infer and identify an author's implicit and explicit meaning in a piece of text. They evaluate the effectiveness of information found in maps, charts, tables, graphs, diagrams, cutaways and through...
Curated OER
Creating and Analyzing Graphs of Tropospheric Ozone
Students create and analyze graphs using archived atmospheric data to compare the ozone levels of selected regions around the world.
Curated OER
Lesson Six: Nonfiction Text Elements (Part One)
Students examine nonfiction text elements in preparation for writing a nonfiction book about Lewis and Clark. In this social studies/language arts lesson, students discuss the term research and complete a cluster map. Additionally,...
Curated OER
Where's the Barbecue?
Learners identify the major landforms, regions and rivers on a map of South Carolina. They compare the locations of the major Native American groups in the state as well. They chart where barbecue restaurants are located and write...
Curated OER
Snow Cover By Latitude
Students examine computerized data maps in order to create graphs of the amount of snowfall found at certain latitudes by date. Then they compare the graphs and the data they represent. Students present an analysis of the graphs.
Curated OER
What Are Alternative Fuels? Concept Mapping Alternative Fuels Investigation
Students compare and contrast the different types of alternative fuels. They create a concept map to understand their classification. They examine the properties of matter and energy as well.
Curated OER
Ocean Currents and Sea Surface Temperature
Students use satellite data to explore sea surface temperature. They explore the relationship between the rotation of the Earth, the path of ocean current and air pressure centers. After studying maps of sea surface temperature and ocean...
Mark Twain Media
Understanding Informational Text Features
Everything you need to know about informational text features can be found in this resource. Recognizing these types of text features and how they are used in text allows readers to better understand information. Teachers...
Curated OER
Where Are the Bugs?
Students trap, collect and identify arthropods in a newly created desert tortoise preserve area over a period of one school year. They determine the rate at which various arthropods take up residence in the newly landscaped area. Data is...
Curated OER
Molecular Biology and Primate Phylogenics
By counting differences in amino acids, biology stars examine the relationships between different primates. With information gleaned, they map out a phylogenic tree and discover common ancestry. You will need to create printable versions...
Curated OER
Indian Women in Texas History
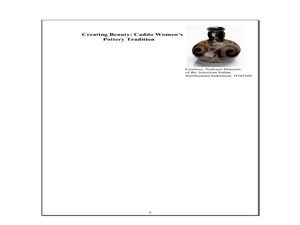
Fourth graders study Indian women in Texas. In this US history lesson, 4th graders discuss what each Indian woman's contribution was by completing a timeline and table. Students examine the Caddo Women's pottery tradition...
Curated OER
Landscape Diversity in the Yukon Territory
Students review and analyze a satellite image of the Yukon territory.
Curated OER
What Do Plants Need to Grow?
Fourth graders control variables to determine the effect on plant growth. They collect information by observing and measuring and construct simple graphs, tables, maps and charts to organize, examine and evaluate information.
Curated OER
Carbondale: The Biography of a Coal Town
Students use a brief history of the growth and decline of the anthracite region in the state to create a photograph and map "peak shaped" time line. They practice map and photo analysis strategies to "read" photographs and maps.
Curated OER
My Family Tree
Students create a family tree. In this ancestry lesson, students research a country that one of their ancestors is from. Students interview a grandparent and map out a family tree.
Curated OER
What's the Matter? (Grade 3)
Third graders organize information about the three types of matter and to reinforce concepts learned in the matter unit of the science curriculum. They use Inspiration software to create a concept map of the three types of matter.


