Curated OER
How Tall is the Average 6th Grader?
Upper grade and middle schoolers explore mathematics by participating in a measuring activity. They hypothesize on what the average height of a male or female 6th grader is and identify ways to find the average mathematically. Learners...
Curated OER
Describing Range and Measures of Central Tendency in Shoe Sizes
Students describe the range and various measures of central tendency using shoe sizes from a video. In this range and measures of central tendency lesson plan, students use the same data set to identify the concepts of range, mode,...
Curated OER
Mean, Median, and Mode
Seventh graders examine the uses of mean, median, and mode. They define key vocabulary terms, observe the teacher model examples of mean, median, and mode, and discuss real world examples of central tendency of sets of data. Students...
Curated OER
Range, Mean, Median, and Mode
Eighth graders find the range, median, mean, and mode of a data set. In this finding the range, median, mean, and mode of a data set lesson, 8th graders collect data about the high and low temperature for 10 different cities. ...
Curated OER
Range, Mean, Median and Mode Through the Internet
Students compute measures of central tendency. In this range, mean, median and mode lesson, students gather information on the internet, organize the data and then compute the measures of central tendency. They create a...
Curated OER
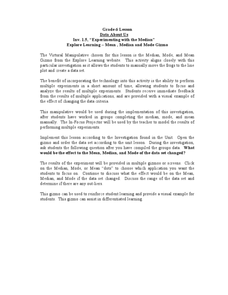
Explore Learning - Mean , Median and Mode Gizmo
Sixth graders experiment with mean, median, and mode. In this online interactive mean, median, and mode lesson, 6th graders analyze the results of multiple experiments and after they work in groups completing the median, mode, and mean...
Curated OER
Mean, Median, Mode and Range
Fourth graders investigate when to find the mean, median, mode and range. In this statistical concepts lesson, 4th graders collect data, make observations and graph the data. Students verify their work on the computer.
Curated OER
Mean, Median, and Mode
Students find the mean, median, and mode for a set of data. They define terms and find examples, as well as complete practice exercises. They work cooperatively to analyze real data from a variety of websites provided. To...
Alabama Learning Exchange
The Mean, Median, and Mode Chain Gang
Students analyze a set of data. They work in cooperative groups and use chain links to identify the mean, median, and mode of the chain.
Curated OER
Mean, Median and Mode
Students explore websites and the included PowerPoint presentation to gain a better understanding of mean, median and mode. A weather worksheet is included for in-class work and assessment.
Curated OER
Ice Cream
Students explore the concepts of mean, median, mode, and range as they elicit data about people's favorite flavor of ice cream. A practical application of the data obtained offers an extension to the lesson plan.
Curated OER
Measures of Central Tendency Using Scientific Calculators
Learners explore mean, median, and mode as they model mathematics in real-world problem situations. The instructional activity requires the use of the TI 30X IIS.
Curated OER
Data Analysis
Young statisticians use and interpret measures of center and spread such as mean, median, and mode as well as range. They use box plots to represent their data and answer questions regarding the correspondence between data sets and the...
Curated OER
Starting With Stats
Statisticians analyze a data set of student IQs by finding measures of central tendency and dispersion such as mean, median, mode, and quartiles. They practice using a graphing calculator to find the values and analyze box plots and...
Virginia Department of Education
Calculating Measures of Dispersion
Double the fun — calculate two measures of deviation. The lesson plan provides information to lead the class through the process of calculating the mean absolute deviation and the standard deviation of a data set. After learning how to...
American Institutes for Research
Digital Smiles
Explore metric measurement, recording data, and creating an electronic spreadsheet displaying results with your math class. Scholars will measure the length of their smiles, record the measurements, and represent the results on an...
Curated OER
Madley Brath #39 - Stem and Leaf Plots, Mean, Median, Mode and Range
For this measures of central tendency worksheet, students draw a stem and leaf plot of a set of test scores. They compute the mean, median, mode, and range of the data set, and round the answers to the nearest tenth.
Curated OER
Super Ticket Sales
Use this graphing data using box and whisker plots instructional activity to have learners make box and whisker plots about ticket sales of popular movies. They find the mean, median, and mode of the data. Pupils compare ticket sales of...
Curated OER
Create Your Own Form
Young scholars gather and organize data using a mock census form, and determine mean, mode, range, and median for sets of data.
Curated OER
How Alike Are We?
Fourth graders find the range, mode, median, and mean for each of the data sets (height and shoe size). They discuss which measure of central tendency for each data set best represents the class and why. Students graph the shoe size and...
Curated OER
What Does Average Look Like?
Fifth graders explore the concepts of range, median, mode, and mean through the use of graphs drawn from models. They use manipulatives to represent data they have collected within their groups, and compare the differences between mode,...
Curated OER
Atlatl Lessons Grades 4-12: Lesson for Beginning Users of Atlatl
Sixth graders determine the mean, range median and mode of a set of numbers and display them. In this data lesson students form a set of data and use computer spreadsheet to display the information. They extend of the process by...
Curated OER
Mean, Median, & Mode
Students determine mean, median, and mode. In this problem solving lesson, students evaluate a set of data to determine the mean, median, and mode. Students work in small groups practicing cooperative learning skills as they problem solve.
Curated OER
Averages: Computing Mean, Mode and Median
Seventh graders use daily temperature models to find the mean, mode and median.


