Curated OER
Using Statistics to Uncover More Evidence
Fifth graders participate in an online Web lesson plan on ways of interpreting data. They conduct a survey and interpret the results in a journal entry.
Curated OER
Galaxy Hunter - A Cosmic Photo Safari
Space science stars journey through our night sky and take virtual photos of galaxies to investigate simple random samples. Higher math is used to analyze the data collected. Copy the evaluation/assessment questions onto a handout for...
Curated OER
Live, From New York
In this data analysis worksheet, learners study the information on a data table about the hosts of Saturday Night Live. Students answer 8 problem solving questions about the table.
Curated OER
Linear Patterns in Data
Eighth graders extend their learning of graphing linear equations and are introduced to connecting patterns in tables and graphs to represent algebraic representations. They then determine patterns and extrapolate information from these...
Curated OER
Mean, Median, and Mode
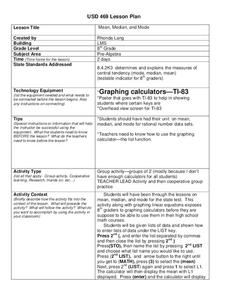
Eighth graders practice using the LIST key on graphing calculators using the proper syntax. They work with the functions of mean, median, and mode in a teacher led lesson and then with a partner on a second data set. They follow...
Curated OER
Nine Examples for Tables, Pictographs, Mean. Median, and Mode
In this graphical representation of data and measures of central tendency worksheet, students calculate mean, median, and mode and answer questions related to graphs, tables, and pictographs.
Curated OER
Statistically Lyrical
High schoolers examine and discuss the writing of ratios as fractions and where they can be found in the real world. They complete worksheets and a questionnaire, and calculate the mean, median, and mode scores for the class.
Curated OER
Measures of Central Tendency
Young scholars analyze data using central tendencies. For this statistics lesson, students collect and analyze data using the mean, median and mode. They create a power point representing the different measures of central tendency.
Curated OER
Global Warming Statistics
Students research real-time and historic temperature data of U.S. and world locations, and analyze the data using mean, median, and mode averages. They graph the data and draw conclusions by analyzing the data. A spreadsheet is used to...
Curated OER
Cars on the Curve
Second graders, using two dice, participate in a car race game called Cars on the Curve. They predict which car wins the game and records it in their Data Diary.
Curated OER
Global Statistics
Students select appropriate data to determine the mean, median, mode and range of a set of data. They calculate the statistical data on literacy rates and life expectancy within each geographic region of the world. Students determine...
Curated OER
Bringing Statistics Alive
Learners compute mean, median and mode and compare mean, median and mode to a real-world application to identify their practical uses. They apply mean, median and mode to real-world statistical data. Finally, students organize data into...
Curated OER
Statistics
High schoolers log their computer usage hours. They determine the mean, median, mode and standard deviation of the collected data. They make a frequency histogram of the grouped data, both on graph paper, and on the TI 83+ graphing...
Curated OER
Exercise Those Statistics!
Students participate in various activities, measuring their pulse rates and recording the data. They analyze the statistical concepts of mean, median, mode, and histograms using the data from the cardiovascular activities.
Curated OER
Central Tendency
Fifth graders compare and contrast different sets of data on the basis of measures of central tendency.
Curated OER
Stem-and- Leaf Plots
Students are introduce to the notion of stem-and-leaf plots. They use stem-and-leaf plots to calculate the mean, median, and mode of a set of data. Students use computers to learn about stem-and-leaf plots.
Curated OER
There Is No Place Like Home on the Range
Fourth graders use data from the real estate guide to find the range, mode, median, and mean of a sampling of homes for sale in their area.
Curated OER
My Test Book: Mean, Median, and Mode
In this math skills worksheet, students solve 10 multiple choice math problems regarding mean, median, and mode. Students may view the correct answers.
Curated OER
Campaign 2000
Students research newspapers and the Internet to learn about the election. Students work in groups and choose a state that they want to compare to Florida. Students organize the data they have found into a graph labeling an "x" and "y"...
Curated OER
Technology vs. Nontechnology
Fourth graders determine the range, mean, median and mode using a computer spreadsheet. An identical set of calculations is done without using a computer. The results of each method are compared. They calculate the mode, median and range...
Curated OER
Box and Whisker Plots
Seventh graders explore the concept of box and whisker plots. In this box and whisker plots lesson, 7th graders plot data on a box and whisker plot. Students discuss the mean, median, and mode of the data. Students discuss range,...
Curated OER
Connecting Measurement
Students participate in activities the connect measurement to geometry, statistics, estimation, and the real world. They collect measurements from their elbow to the tip of their middle finger and make a box plot of the data as well as...
Curated OER
Probability: The Study of Chance
Students conduct an experiment, determine if a game is fair, and collect data. They interpret data, then display line graph. They conduct analysis of game for probability.
Curated OER
M&M's and the Scientific Method
Sixth graders explore the scientific method by conducting an in class experiment. For this scientific averages lesson, 6th graders discuss the concept of the scientific method, and define the different mathematical averages, mean, median...


