Curated OER
Statistical Analysis of Data by Gender
Students examine and identify gender bias, stereotyping, and discrimination in school materials, activities, and classroom instruction. They apply descriptive statistics knowledge to real-world data.
Newspaper Association of America
By the Numbers: Mathematical Connections in Newspapers for Middle-Grade Students
A cross-curricular resource teaches and reinforces mathematical concepts with several activities that use parts of a newspaper. Scholars use scavenger hunts to find the different ways math is used in the paper along with using data...
Curated OER
Statistics of Mars
Students explore the concept of central tendencies. In this central tendencies lesson plan, students sort M&M's or Skittles based on color. Students graph their results. Students find the mean, median, and mode of their data.
Curated OER
Lessons for Atlatl Users with Some Experience-Grade 6
Sixth graders experiment with an atlatl and dart. In this sixth grade data management mathematics instructional activity, 6th graders explore and determine the most suitable methods of displaying data collected from their...
Curated OER
Integration: Statistics, Measures of Central Tendency
Learners find the mean, median, and mode for each of four data sets. They are given two line plots, and compute the median and mode of the shown data. They find the median and mode for three stem and leaf plots. They solve two word...
Curated OER
Measures of Center
In this statistics worksheet, students find mean, median, and mode for 3 problems. They find the mean of summarized data in 2 problems.
Curated OER
Special Ed. Resource
Ways to organize data is the focus of this math PowerPoint. Students view slides that define and give descriptions of a variety of graphs, and how mean, median, and mode are found. A good visual tool which should benefit almost all types...
Curated OER
Density of a Paper Clip Lab Review
Even though this assignment is brought to you by Physics Lab Online, it is best used as a math practice. Middle schoolers calculate the range, mean, mode, and median for a list of eight different paper clip densities. They analyze...
Curated OER
How Alike Are We?
Fourth graders find the range, mode, median, and mean for each of the data sets (height and shoe size). They discuss which measure of central tendency for each data set best represents the class and why. Students graph the shoe size and...
Curated OER
How Big Is Your Head?
Learners explore measurement by measuring classmates' heads. They record their measurements and they put the measurements in order from smallest to largest. Students figure the mean, median, mode, maximum, minimum, and range of their...
Curated OER
Word Problems That Involve the Mean (II)
In this word problem learning exercise, learners examine real world problems. They compute the mean, median, and mode of given problems. This one-page learning exercise contains 5 multi-step problems. Answers are provided.
Curated OER
Great Graphing
Students collect data, use a computer spreadsheet program to create various graphs, and compare the graphs. They state the findings of each graph in writing and decide which graph type best represents the data.
Curated OER
Finding Mean, Mode and Median in the Computer Lab
Students create spreadsheets which will display and figure mean, median, and mode of a set of numbers.
Curated OER
The Great Race
Students identify the mean, median and mode of collected data. In this statistics instructional activity, students collect, graph and analyze data using central tendencies. They work in groups to collect data on a robot through an...
Curated OER
Making Data Meaningful
In this sample mean worksheet, students explore different ways "average" is used. Students use this information to find the sample mean of the height of a large class of students. Students find the mean, median, mode and range of two...
Curated OER
Mapping River Statistics
Students research different statistics to do with the Mississippi River. They answer questions about finding data and collect it by conducting research. The research is used to construct a data table. Then students use the table to...
Curated OER
What is a Box and Whisker Plot?
Eighth graders explore the correct use of box and whisker plors. The times when they are appropriate to use to compare data is covered. They plot data according to statistical analysis including mean, median, and mode.
Curated OER
Data Analysis
In these analyzing data worksheets, learners complete a table and a pie chart and calculate mean, median, mode, and range for sets of data.
Curated OER
Computing Mean, Mode and Median
Ninth graders collect data on basketball player's heights and determine the mean, median, and mode for the data.
Curated OER
Investigating Median, Mode, and Mean
Students develop strategies to organize data while following teacher demonstration. They calculate the mean, median and mode of a data set while determining the relationships between the numbers. They analyze data from tables and double...
Curated OER
Temperature Bar Graph
Students explore mean, median and mode. In this math lesson, students analyze temperature data and figure the mean, median, and mode of the data. Students graph the data in a bar graph.
Curated OER
Mean, Median, and Mode for Frequency Tables
For this mean, median, and mode worksheet, students solve 10 short answer problems. Students find the mean, median, and mode of various data sets. Students make frequency tables from the data sets.
Curated OER
Mean, Median, Mode and Range
Sixth graders identify the mean, median, mode and range in a given set of data. Using a specified website, they use their skills to play the game, "Train Race" where students find the mean, median, and rage of information to help the...
Curated OER
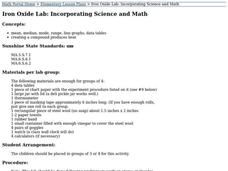
Iron Oxide Lab: Incorporating Math and Science
Students conduct an experiment in small groups, draw conclusions about the amount heat of a compound achieves and practice their data analysis skills.


