Curated OER
Mean, Median, Mode and Range Sheets
In this math worksheet, students use the graphic organizer to display their answers when learning about measures of central tendency. There are 4 boxes: mean, median, mode and range.
Curated OER
Geometry Review
In this math review learning exercise, students calculate the mean, median, mode, range, line segments, angles, and standard deviation for number and word problems. Students complete 11 problems.
David Pleacher
Candy Math Fun
Few things can motivate children to learn like the promise of a sweet and tasty treat. Given a bag of M&M®s, Skittles®, or other colorful candy, students first predict the contents of the bag before counting the pieces, creating a...
Curated OER
Statistics - Central Tendency
In this statistics activity, students solve and complete 13 different problems that include creating various box-and-whisker plots. First, they write a definition for mean, median, mode and range. Then students explain how to determine...
Curated OER
M&Ms; Line Plots and Graphing
Students, using small individual bags of M&Ms, engage in activities including; estimating, sorting, graphing, mean, median, mode, fractions, percentage, and averaging.
Curated OER
Find the Range #5
In this mathematics worksheet, students view 6 different sets of numbers. Students, for each set of numbers, find the mean, mode, median and range. Students place their answers in the boxes provided.
Math Mammoth
Stem-and-Leaf Plots 3
In this stem-and-leaf instructional activity, students place statistical data in a stem-and-leaf plot. They identify the median, and range in a given set of data. There are four multi-step problems on this one-page instructional activity.
Curated OER
Find the Mode Worksheet #4
In this finding the mode worksheet, 5th graders find the mode of 6 sets of numbers. They write the mode of each set in the box below the numbers.
Curated OER
Beyond Averages: Median, Mode and Range
In this median, mode and range learning exercise, students complete a set of 10 multiple choice questions, clicking on an answer link to view correct answers.
Curated OER
How Tall is the Average 6th Grader?
Upper grade and middle schoolers explore mathematics by participating in a measuring activity. They hypothesize on what the average height of a male or female 6th grader is and identify ways to find the average mathematically. Learners...
Curated OER
Mean, Median, and Mode
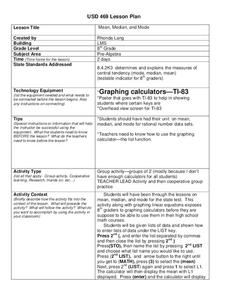
Eighth graders practice using the LIST key on graphing calculators using the proper syntax. They work with the functions of mean, median, and mode in a teacher led lesson and then with a partner on a second data set. They follow...
Curated OER
Out to Lunch
Sixth graders create a menu. In this math lesson, 6th graders use mean, median and mode to determine the prices for the typical cost of an appetizer, entree, kid's meal, drinks and dessert. Students write a number sentence to show how...
Curated OER
Lesson 56
Sixth graders practice Least Common Multiple in fractions. In this fraction lesson, 6th graders look at two different fractions and find a common denominator. They sing a song to memorize mean, median, and mode.
Math Moves U
Collecting and Working with Data
Add to your collection of math resources with this extensive series of data analysis worksheets. Whether your teaching how to use frequency tables and tally charts to collect and organize data, or introducing young mathematicians to pie...
Curated OER
Measures of Central Tendency: Pages 178-183
In this math worksheet, students find the mean, median and mode for 2 stem and leaf tables, 4 number sets. Students also find a set of numbers for given mean, median and mode.
Curated OER
Bringing Statistics Alive
Learners compute mean, median and mode and compare mean, median and mode to a real-world application to identify their practical uses. They apply mean, median and mode to real-world statistical data. Finally, students organize data into...
Curated OER
Temperature Bar Graph
Students explore mean, median and mode. In this math lesson, students analyze temperature data and figure the mean, median, and mode of the data. Students graph the data in a bar graph.
Curated OER
Stem-and- Leaf Plots
Students are introduce to the notion of stem-and-leaf plots. They use stem-and-leaf plots to calculate the mean, median, and mode of a set of data. Students use computers to learn about stem-and-leaf plots.
Curated OER
Jumping Jaguars!
Second graders accurately measure the distances they and their classmates jump. They determine the mean, median and mode of specific jumps. They are required to have two measurements for each classmate, one for standing long jump and one...
Curated OER
Campaign 2000
Students research newspapers and the Internet to learn about the election. Students work in groups and choose a state that they want to compare to Florida. Students organize the data they have found into a graph labeling an "x" and "y"...
Curated OER
Connecting Measurement
Students participate in activities the connect measurement to geometry, statistics, estimation, and the real world. They collect measurements from their elbow to the tip of their middle finger and make a box plot of the data as well as...
Inside Mathematics
Suzi's Company
The mean might not always be the best representation of the average. The assessment task has individuals determine the measures of center for the salaries of a company. They determine which of the three would be the best representation...
Curated OER
Button Bonanza
Collections of data represented in stem and leaf plots are organized by young statisticians as they embark some math engaging activities.
Noyce Foundation
Ducklings
The class gets their mean and median all in a row with an assessment task that uses a population of ducklings to work with data displays and measures of central tendency. Pupils create a frequency chart and calculate the mean and median....
Other popular searches
- Math/data Mean Mode Median
- Math Ata Mean Mode Median
- Math/ Mean, Mode, Median
- Math at Mean Mode Median
- Math Median Mode Mean
- Math/ Mean Mode Median


