Statistics Education Web
It Creeps. It Crawls. Watch Out For The Blob!
How do you find the area of an irregular shape? Class members calculate the area of an irregular shape by finding the area of a random sampling of the shape. Individuals then utilize a confidence interval to improve accuracy and use a...
Virginia Department of Education
Curve of Best Fit
Which function models the data best? Pupils work through several activities to model data with a variety of functions. Individuals begin by reviewing the shapes of the functions and finding functions that will fit plotted data points. By...
Florida Center for Instructional Technology
Two for One Box Company
Given a box of certain dimensions, young mathematicians must determine if a box that is twice as big, actually holds twice as much. This is a brain-teaser of a problem. The worksheet provides a handy table that has learners calculate the...
Curated OER
Two for One Box Company
Here is a challenging and thought-provoking math worksheet. In it, learners work together to construct a variety of boxes of different sizes to see if doubling the size of a box really means it can hold twice as much stuff as the...
Curated OER
Hopping by 2s
Hop to it! Young counters practice skip counting by two using illustrations of animals hopping from place to place. Each image shows a number sequence and scholars draw in the path as they move from number to number. Encourage them to...
Achieve
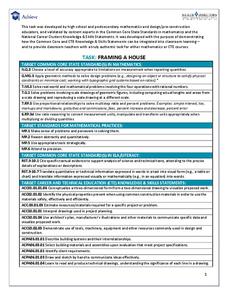
Framing a House
If members of your class wonder where they can use the math they learn in middle school, let them discover the answer. Learners apply geometry concepts of scale and measure to calculate the costs of framing a house addition.
Curated OER
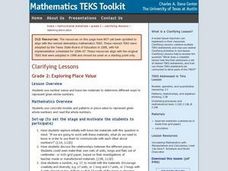
Grade 2: Exploring Place Value
Creative problem solving is fun and helps kids conceptualize content. They use grid paper, manilla paper, and markers to cut, draw, and show given double-digit numbers as many ways as they can.
Curated OER
Linear Equations
Eighth and ninth graders solve and graph 42 different problems that include writing various equations and graphing them on a grid. First, they create a table for each equation and graph it on a grid locating the x-and y-intercepts. Then,...
Alabama Learning Exchange
Polygons-Changing Area Versus Changing Perimeter
Investigate the area and perimeter of polygons in this geometry lesson. Young geometers use grid paper to draw a quadrilateral and calculate its area and perimeter. They also read The Greedy Triangle to identify the changing shape of...
Mathematics Assessment Project
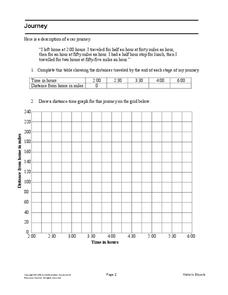
Journey
Drive home math concepts with an engaging task. Learners follow a verbal description to fill in a table and create a distance-time graph representing a car journey. They then answer questions by interpreting the graph.
Curated OER
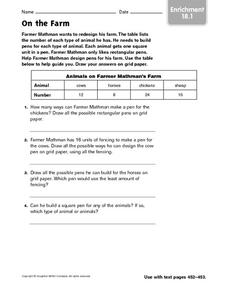
On the Farm - Enrichment 18.1
In this square unit worksheet, students read the word problem about the pens Farmer Mathman wants to build for his animals. Students then use the table to guide them. Students draw their answers on grid paper and then answer the four...
Mathed Up!
Cumulative Frequency and Box Plots
Learn how to display data. Young data analysts watch a video to review how to create cumulative frequency histograms and box plots. They work on a set of questions to practice producing these data displays.
Curated OER
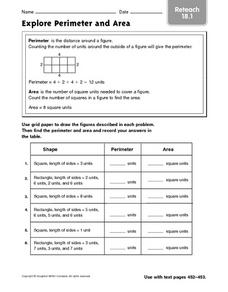
Explore Perimeter and Area - Reteach 18.1
In this perimeter and area instructional activity, learners review the steps to find perimeter and area. Students then use grid paper to draw the figures described in 6 questions. Learners note the perimeter and area of shapes as well.
Curated OER
Scaled Measurements
Introduce youngsters to the concept of scale measurement and the uses of scale drawing. They are provided with an explanation and then given two examples of how scale measurements work. This would be a good resource to use prior to...
Curated OER
Drawing Figures
Third graders draw shapes that are congruent. In this congruency lesson plan, 3rd graders use grid paper to draw letters and figures and their congruent partners. They complete a worksheet while working in a whole class setting with the...
Curated OER
Weave Drawing - Pencils
Students create a work of art based on a theme showing skill in pencil shading. They create a work of art showing value contrast to center of interest. They use math concepts to enlarge a composition using a grid.
Curated OER
Map Grids
Students study map grids and explore how they can be used to locate positions of objects or features on a map. They read a story and then participate in a grid activity using a large map of the setting of the story.
Curated OER
Independent Practice 1: Placing Items on a Grid
In this placing items on a grid worksheet, students draw specified pictures on a coordinate plane in an instructed location. All locations are identified by an ordered pair. This one-page worksheet contains 20 problems.
Curated OER
Centimeter Grid
In this learning tool worksheet, 6th graders will draw or depict information on a blank centimeter grid. There is a space for name and date at the top.
Curated OER
Draw Shapes on the Grid: Independent Practice 2
For this drawing worksheet, students draw shapes on a coordinate plane at the specified location. They interpret a given ordered pair and then draw a star, circle, triangle, or square as directed. This one-page worksheet contains two...
Curated OER
Grid Sheet
In this grid activity, students use these grids to draw graphs of problems they solve. Students have 2 grids to use on this activity.
Inside Mathematics
Functions
A function is like a machine that has an input and an output. Challenge scholars to look at the eight given points and determine the two functions that would fit four of the points each — one is linear and the other non-linear. The...
Curated OER
Graph Picture (Coordinate Pairs)
Coordinate graphing on a grid is the focus of this learning exercise. Young mathematicians plot 42 coordinate pairs on a graphing grid, then connect the dots to make a picture. A fun way to get your learners involved in graphing!
Curated OER
Easter Graphing Fun
Graphing can be festive! This Easter instructional activity has scholars using coordinates to record the location of ten holiday images. The first is done for them, and the grid is large and appealing to younger learners. Consider...


