Curated OER
Nonprofits Are Necessaary
Young scholars research community nonprofit organizations. They identify their purposes and graph them. The search telephone books, websites, and magazines for information on local organizations. They write in journals how nonprofit...
Curated OER
Arizona!! How the Heck Did I End Up Here???
Students research the historical background of the potato. In this potato research instructional activity, students cut out the important dates in potato history. Students make a timeline for the events.
Curated OER
The Large and Small of It
Students explore the extreme between the distance to the moon in comparison to the size of a particle of moon dust and solve problems related to the Apollo space missions.
Curated OER
A is for Apple
Students participate in a variety of activities to learn about apples. Students graph apples, learn about apple uses, taste apples, and observe what happens when apples are dipped in lemon juice.
Curated OER
Pecan Power
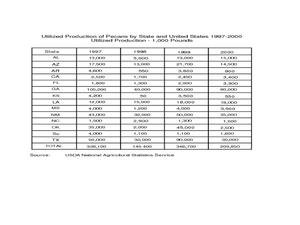
Students study the origins of pecans and complete a bar graph from the data they have discovered. In this pecan lesson plan, students draw pecans, discuss a pecan time line, and draw a bar graph comparing Arizona pecans to other...
Curated OER
What are the Odds
Learners predict the-outcome of an event. In this algebra lesson, students compare and contrast the probability of an event occurring. They calculate the odds of a simple event and make estimation.
Curated OER
What Are The Chances
Students calculate the probability of an event occurring. In this probability lesson, students differentiate between independent, dependent or compound events. They find the range of the data.
Pennsylvania Department of Education
Geoboards
Students describe shapes to their classmates using specific properties and practice making triangles on geoboards. In this geoboards lesson plan, students use string on the geoboards.
Curated OER
Number Writing Poems
Students read the short poem for each number to help them with number formation. For this numbers lesson plan, students follow directions of the poems.
Pennsylvania Department of Education
Fractions of a Set
Students explore number sense by completing a number set worksheet. In this fractions lesson, students utilize pattern blocks as a visual reference to the fractions they practice identifying. Students read the book Clean-Sweep Campers...
Pennsylvania Department of Education
Fractions and Ribbons
Fifth graders solve division problems using partial quotients. In this long division lesson, 5th graders practice seeing division as a process of repeated subtraction and estimation. This lesson provides a script for the teacher.
Pennsylvania Department of Education
Round Numbers to Nearest Ten or Hundred
Third graders review telling time. In this lesson on telling time, 3rd graders discuss various items that show length of time, including clocks, calendars and sand timers. Students review and practice what they already know about telling...
Curated OER
What Does Percent Have to Do With It?
Fourth graders go shopping for a real life experience involving percent. They explore the concepts of sales tax and discount prices.
Curated OER
Rising and Falling Fractions
Students explore outcomes from the conversion of fractions to decimals in stock market quotes and explore fluctuating interest rates using an amortization calculator.
Curated OER
Subtraction Shopping
Students subtract two digit numbers. They check each other's answers for accuracy.
Curated OER
Trigonometric Functions of Special Angles
Young scholars explore the concept of the six trigonometric functions, places where the functions can be utilized, and apply these functions to several electrical application problems.
Curated OER
Playing In The Dirt - Discovering Soil
Students discuss some the different types of soil in Oklahoma. They identify the soil types and explore the characteristics of each type of soil. In groups, students perform hands-on activities such as taking soil samples, classifying...
Curated OER
57 Varieties of Interdependence
Students examine the life of Henry J. Heinz and how he began his career in food service. For this economic history lesson,students study how Henry J. Heinz started his business. Students will create and answer key...
Curated OER
3 dimensional shapes
Students play a bingo game to classify 3 dimensional shapes. In this 3 dimensional shapes lesson plan, students identify, describe, and classify shapes by playing a bingo game.
Pennsylvania Department of Education
Adding and Subtracting Three-Digit Numbers by Jumping
Second graders use data to graph information and draw conclusions. For this lesson on data analysis, 2nd graders practice gathering, sorting, comparing, and graphing data. Students differentiate data that can and cannot change over time.
Curated OER
Partial Products
Students use the partial products algorithm to complete multiplication problems. For this partial products lesson plan, students are introduced to the algorithm and connect the relationship to multiplication and division problems.
Curated OER
Visual and Number Patterns
Fourth graders develop strategies for identifying geometric and number patterns. In this mathematical patterns instructional activity, 4th graders use pattern blocks to make repeating patterns with numbers and shapes. Students then...
Curated OER
Perimeter and Area
Fifth graders identify the area and perimeter of a rectangle. For this perimeter lesson, 5th graders use geoboards and rubber bands to construct various rectangles. Students use the formula to calculate area and perimeter of the...
Curated OER
Comparison of Two Different Gender Sports Teams - Part 1 of 3 Measures of Central Tendency
Students gather and analyze data from sports teams. In this measures of central tendency lesson, students gather information from websites about sports team performance. Students analyze and draw conclusions from this data. This lesson...


