Curated OER
Monopoly Graphs
Students relate the concepts of linear functions to the game of monopoly. For this algebra lesson, students solve problems with ratio and proportion. They collect data and graph it.
Curated OER
Curve Fitting
Pupils investigate linear, quadratic, and exponential regressions. They plot sets of data points, determine the regression equation that best fits the data and lastly investigate the coefficient of determination.
Curated OER
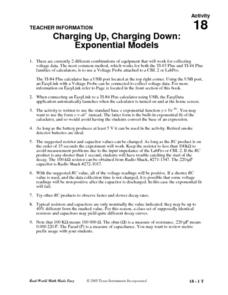
Charging Up, Charging Down
Learners collect and analyze voltage data. Then, they investigate exponential functions using the TI and a Voltage Probe and graph their data and analyze it using a table.
Curated OER
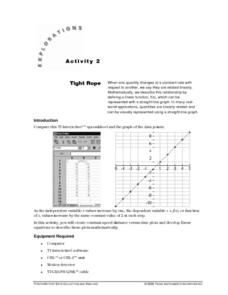
Tight Rope
Learn how to explore the concept of linear functions. In this linear functions lesson, students collect linear data from a motion detector. Students walk to create a linear function. Students plot the points on a graph and determine a...
Curated OER
Beginning Graphs in MS Excel
Students practice creating graphs in Microsoft Excel. In this technology lesson, students conduct a random survey and collect data. Students use the Microsoft Excel program to create a bar graph of the data.
Curated OER
Energy Content of Foods
Learners collect data, organize and analyze the data and compare it to real life scenarios. This assignment requires two class periods.
Curated OER
TI Workshop Presentation Guide for "Preparing for Proofs"
Pupils discover proofs using the TI in this geometry lesson. They collect data from newspaper and magazines and analyze their data using the TI, relating it to proofs.
Curated OER
FCAT Real World Solving Linear Equations/Systems
Pupils relate real life situation to the equations, graphs and inequalities. They model real life scenarios using matrices and draw conclusions from their data. This lesson plan is aligned with FCAT.
Curated OER
Chill Out: How Hot Objects Cool
Teach how to explore exponential equations. In this Algebra II lesson, learners investigate the graph that occurs as a hot liquid cools. Students model the data algebraically.
Curated OER
Wolves
Students explore wolves. In this ecology and wolves lesson, students research predator-prey relationships on the Internet and complete a related worksheet with a partner. Students interpret data on bar graphs to determine growth and...
Curated OER
West Nile Virus and Lyme Disease: Making Sense of the Numbers
In an interdisciplinary exploration, trace the development of West Nile fever and Lyme diseases. Pupils discover how these diseases are contracted. They collect statistical data and analyze trends.
Curated OER
Pizza Fractions
Everyone loves pizza! Learners define fractions and use manipulatives to calculate fractions. Kids cut circles to represent various fractional parts of a pizza. Some accommodations are included.
Curated OER
Involving Community Members, Parents, and Community Agencies in Student Learning
Students predict and estimate the number of moose shot by people between the years of 1986-1990. They analyze data and statistics, construct bar graphs, and conduct research on the Alaskan moose.
Curated OER
Creating and Reading a Pictograph
Second graders examine how data can be transferred into pictures on a pictograph. They analyze data on a graph about chewing gum, and create a pictograph that illustrates data about their preferences for the taste of bubble gum. ...
Curated OER
Tally Charts and Graphs
Fourth graders play the game 'Data Picking', where they collect data, place the data into a tally chart, and choose the circle graph that best represents the data. They go to the Mathfrog website and select 'Picking'. Students choose...
Curated OER
Fun Creative Activities that Teach Math
Students have fun with math. In this math skills lesson plan, students collaborate to solve the problems presented in this interactive lesson plan. The problems pertain to geometry, measurement, probability, number sense, and algebra.
Curated OER
Mean, Median, Mode and Range
Sixth graders identify the mean, median, mode and range in a given set of data. Using a specified website, they use their skills to play the game, "Train Race" where students find the mean, median, and rage of information to help the...
PricewaterhouseCoopers
Credit and Debt: Understanding Credit Reports and Managing Debt
Credit cards are tempting to use right out of high school. Teach your upperclassmen the benefits and challenges of credit and how it can affect their future. The lesson covers credit scores and ways to strengthen credit if learners find...
Curated OER
Student Census
Students collect data from their peers and store the information in a database. As students manage the information they realize the usefulness of a database as a tool to manage large amounts of information in an efficient and accurate...
Curated OER
Box-and-Whisker Plots
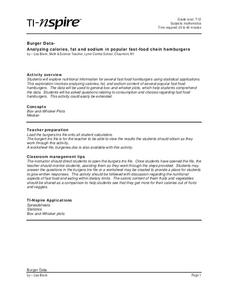
Students explore nutritional information for several fast food hamburgers using statistical applications. In this statistics instructional activity, students analyze calories, fat, and sodium content of various fast food restaurants....
Curated OER
Taste the Rainbow
Middle schoolers practice estimating and graphing by utilizing Skittles. In this statistics lesson, students complete worksheets based on the likelihood of a certain color of skittle coming out of the bag. Middle schoolers create a...
Curated OER
Separating Soup Mix
Students use screens of three sizes to separate a mixture of five solid materials. They plan and conduct simple investigations using appropriate tools, measures, and safety rules and record and report observations, explanations, and...
Curated OER
Lake Pepperidge Farm
Students calculate proportions to determine the total population of Lake Pepperidge Farm. They collect a blind sample of fish and count the number of tagged and untagged fish. They collect data from all samples and record the data in a...
Curated OER
Line of Best Fit
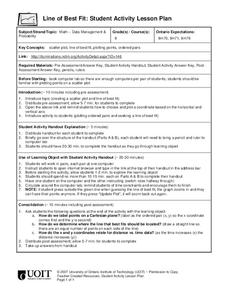
Students calculate the equation of the line of best fit. For this statistics lesson, students create scatter plots and find the line of best fit going through their data. They make predictions and draw conclusions.


