Curated OER
Graphing
Learners collect data to create different types of graphs-line, pie, and bar graphs. They use StarOffice 6.0 to create graphs.
Curated OER
Shake, Rattle and Roll
Sixth graders explore the causes and effects of earthquakes. They also collect and analyze data in graphs. They also use the Internet to research earthquakes
Curated OER
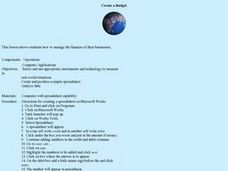
Create a Budget
Students develop a budget spreadsheet to manage finances for their business. In this finance lesson, students use a spreadsheet program to create a budget with credit and debit columns. There are step-by-step directions for creating a...
Curated OER
Money Management
Young scholars choose an occupation and set up a paper family and household. They create a monthly budget, pay monthly bills and file taxes. They practice math skills using financial information and view money as a resource. They create...
Curated OER
How Diverse is That?
Students discuss biological diversity in ocean communities. In this diversity lesson, students examine the variety of organisms compared to relative abundance. They will write an analysis and discuss their findings with the class.
Curated OER
Lucky 7s
This helpful lesson explores the probability in tossing a coin and throwing dice. Specifically, it looks at the probability of getting numbers that are significant to the game of craps, assuming that once the math is understood, most...
PwC Financial Literacy
Planning and Money Management: Spending and Saving
Financial literacy is such an important, and often-overlooked, skill to teach our young people. Here is a terrific lesson which has pupils explore how to come up with a personal budget. They consider income, saving, taxes, and their...
Curated OER
Function Graphing--ID: 8252
Those graphing calculators can be tricky; good thing Texas Instruments has devised a lesson on how to use their TI-Nspire calculator to graph functions. Kids investigate functional notation as they graph ordered pairs in the form (a,...
Curated OER
Completing University
Students analyze the pros and cons of completing a 4 year school. In this statistics lesson plan, students complete surveys and use E-STAT to graph their data. They learn to plot and build diagrams.
Curated OER
Using Active Learning to Reinforce Mathematics
Students predict, then measure how far a bug can travel on a "course" over a specified amount of time, then construct graphs based on the data they acquire.
Curated OER
Measuring Elapsed Time
Fifth graders convert units within the same measurement system and be able to determine elapsed time. They are given a start time and an end time of a game. Students determine the amount of elapsed time from the data that is given.
Curated OER
What's Shaking? Three-Lesson Unit
Your young architects use the Internet to research tall structures or sky scrapers to help in the design of their scale drawings. This is lesson one of three in which learners design, build, and test model skyscrapers for seismic safety....
Curated OER
Timed Multiplication Test Graphs
Students use the tools of data analysis for managing information. They solve problems by generating, collecting, organizing, displaying histograms on bar graphs, circle graphs, line graphs, pictographs and charts. Students determine...
Curated OER
Wings and Othe Things
Learners work in groups that are engaged in different activities at different times. They watch the video "Madagascar" and collect data pertaining to the Fish Eagle's arm spam. They work together to perform mathematical computations...
Curated OER
No Title
Sixth graders, after reviewing and studying the basics of recording, analyzing and presenting data, create on graph paper a bar or line graph to represent given data and then interpret the data. They answer questions about the given data...
Curated OER
Database Lesson
Students access the Internet to locate data regarding their assigned mathematician. They organize their notes onto a data form, then enter it into a database, and sort the database according to given criteria.
Curated OER
Distribution of children living at home
Students examine census data to evaluate the number of students of certain ages living at home. This data is then used to determine the need for day care, or other social programs. They use this information to explore social policies.
Curated OER
How is Your Driver Doing?
Sixth graders explore the concept of averaging of numbers and the function of a spreadsheet. Data is collected, analyzed, and displayed in this lesson. The NASCAR race results provides the basis for the collection of data.
Curated OER
The Tale of Scale
Eighth graders, using a range of data, produce three bar graphs for various scales along the y-axis.
Curated OER
Geo Jammin'
Students compare and contrast related two- and three-dimensional shapes, and complete a Venn diagram illustrating the attributes of each. Using a poem pattern from another lesson, students use data from the diagram to write an attribute...
Curated OER
Raising the Bar While Hogging the Ham (Radio That Is)
Young scholars create a bar graph that communicates an amount without the need to know the exact data, determine what scale to use to best represent the data and use their bar graph to persuade others.
Curated OER
Water Quality Monitoring of Natural Water
Students set up their own monitoring system. They collect samples from an appropriate sampling site. They analyze data and determine the water quality. They present their information to the class and draw a conclusion.
Curated OER
Bar Graphs Using M & Ms
Fifth graders observe an overhead of a graph on which M & Ms have been poured out. A volunteer comes up and separates the colors writing on the overhead how many there were of each color and another person labels the graph's title....
Curated OER
Spaghetti Bridges: Student Worksheet
Pairs of learners work together in order to simulate how engineers test materials for strength and safety in the real world. They use paper cups and pieces of spaghetti to run strength tests. This excellent worksheet should lead to...


