Curated OER
Making Change
Second graders explore how to incorporate a new type of technology, the cash register and/or a calculator, as a motivational tool for solving real life problems. They practice estimating money and counting back change from $20.00.
Curated OER
ACC Basketball Statistics
Middle schoolers use math skills and create a spreadsheet. In this statistics and computer skills activity, students gather ACC basketball statistics, convert fractions to decimals and then percents. Middle schoolers use the gathered...
Curated OER
Calculating Profits from Selling Virtual Lemonade
Students set up and collect data for a virtual lemonade stand. In this entrepreneurship, economics, and technology lesson, students purchase ingredients, determine costs, and set up a virtual lemonade stand. Students consider weather...
Curated OER
Modeling Atoms
High schoolers create an atomic model using a computer program. For this technology lesson, students identify the difference between radius and diameter. They create circular patterns and spheres based on certain specifications.
Curated OER
When a Ruler is Too Short
Young scholars measure distances using parallax. In this math lesson, students explain how this method helped astronomers with their studies of the solar system. They determine the length of their arm using parallax and compare it with...
Curated OER
Presidential Trading Cards
Learners research the Internet to collect data about the US Presidents. They use the data that they collect along with available technology to produce trading cards and brochures using keyboarding skills, text boxes, acquiring photos,...
SMART Project
Shop with Us at Whelan School
Third graders use their math and research skills to create and manage a classroom/school store. They use a computer to manage, organize and access information. They practice pricing products, computing sales, counting money and making...
Curated OER
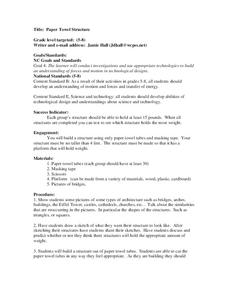
Paper Towel Structure
Learners investigate technology and its purpose in the workplace. In this geometry lesson, students design and build a paper towel structure to investigate motion and forces. They are given a restricted weight and asked to build their...
Curated OER
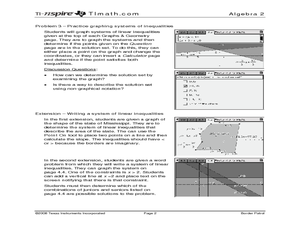
Border Patrol ID: 11603
Incorporate technology in your classroom by teaching your students how to graph systems of linear inequalities as they apply to an area of land. The lesson provides an extension in which students are challenged to write a system of...
Curated OER
Living on Your Own -- Let's Calculate the Cost!
Young scholars review basic math skills, such as addition, subtraction, multiplication, division, finding averages, and working with percentages. They see how these skills apply to real life situations.
Curated OER
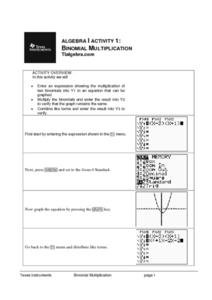
Binomial Multiplication
Learners explore binomial multiplication through the use of technology. Using a graphing calculator, you pupils enter the binomial expression into Y1, multiply the binomials and enter that result into Y2, and combine like terms and enter...
Curated OER
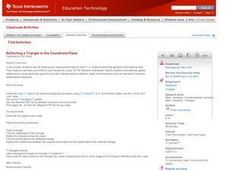
Reflecting a Triangle in the Coordinate Plane
Learners explore geometric concepts using technology. They manipulate the TI to find important math topics. This activity requires a TI-84 or higher.
Curated OER
Creating AB Patterns
Students work with patterns. In this pattern lesson, students find AB patterns in nature and the manmade world. They create their own AB pattern using math manipulatives and visual arts.
Curated OER
Local Linearity
In order to investigate local linearity, students graph the function on the TI-calculator and zoom to observe the change in slope on the line. They incorporate technology to visualize these problems.
Curated OER
What Does Time Have to Do with it?
Learners investigate time. In this investigative lesson, students run through an obstacle course using standard timers. They record the time and apply this knowledge to problems in math. Learners record their predictions, and graph...
Curated OER
Leonardo da Vinci
Middle schoolers select appropriate tools and technology to perform tests, collect data, and display data. They construct appropriate graphs from data and develop qualitative statements about the relationships between variables.
Curated OER
Exploration Sequence of Bounces
New skills are developed as students use graphing calculators and ranger technology to capture and graph the sequence of bounces a ball makes when dropped. After recording the height of four or more bounces, they use the collected data...
Curated OER
First Rhythmic Composition
Young scholars apply fractions to counting rhythm in music. In this algebra lesson, students interrelate the concept of math into music as they fill out a chart identifying the names and symbols of music notes and their equivalent values...
Curated OER
The Robot Artist--Aaron
This is a creative multidisciplinary lesson which will involve students in art, technology, and psychology. Students learn about Harold Cohen who created a robot programmed to create art. Students will also enjoy the sand pendulum...
Curated OER
Follow the (exponent) Laws!
Young scholars participate in technology-rich activities with the common goal of strengthening Students' understanding of simplifying expressions that involve exponents. They work in heterogeneous groups to discover the laws of exponents.
Curated OER
Quadrilaterals: Four-sided Figures
Fifth graders engage in a variety of hands-on and technology-rich activities involving the classification of quadrilaterals. They utilize protractors and rulers to investigate the characteristics of various types of quadrilaterals. They...
Curated OER
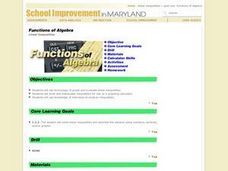
Functions of Algebra
Students use technology graph and evaluate linear inequalities. They write and manipulate inequalities for use on a graphing calculator. In addition they apply their skills to analyze inequalities. Answer Key included.
Curated OER
Introduction to Measures of Central Tendency and Variability
Young scholars calculate the mean, median, mode, range, and interquartile range for a set of data. They create a box and whisker plot using paper, pencil and technology.
Curated OER
Making Informed Decisions Using Measures of Central Tendency
Students calculate the mean, median, mode, range, and interquartile range for a set of data. They create a box and whisker plot using paper and pencil and technology and determine which measure of central tendency is the most helpful in...
Other popular searches
- Educational Technology Math
- Immigrant Math Technology
- Math Technology Projects
- Math Technology Triangles
- Math Technology Excel
- Computer Technology Math
- Surveys Math Technology
- Math Technology Lesson Plans
- Technology +Math
- Math Technology Lesson
- Gps Technology Math Science
- Technology Math Lesson Plan


