Curated OER
M&M Graphing
Youngsters sort M & M's by color. They graph the M&M's by color on a graph. This classic lesson is a wonderful way to introduce the concept and technique of graphing to young mathematicians. Pairs of kids can make up their own...
Curated OER
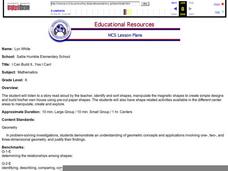
I Can Build It.....Yes I Can!
Kindergartners listen to a story read by their teacher, then use magnetic shape pieces to construct simple designes. They "build" their own house using pre-cut paper shapes. This age-appropriate lesson would be an excellent choice for...
Curated OER
Get in Shape with Geometry
Using geoboards, computer programs, and hands-on manipulative materials, elementary schoolers engage in a study of two and three-dimensional geometric shapes. This lesson is chock full of good teaching ideas on the subject, and the...
Curated OER
The Bean Growth Experiment
Fifth graders use modern technologies which allow them to gain a new, dynamic, and intersting understanding of themselves, their community, and the world. They focus on environmental education and the effect of the environment on plant...
Curated OER
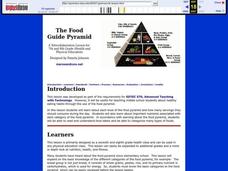
The Food Guide Pyramid
Students examine each level of the food pyramid and how many servings they should consume during the day. They study the important nutrients associated with each category of the food pyramid.
National Council of Teachers of Mathematics
National Debt and Wars
Take a functional approach to the national debt. Learners collect information about the national debt by decade and plot the data. They determine whether an exponential curve is a good fit for the data by comparing the percent changes...
Curated OER
Graph Mole
Practice graphing ordered pairs by playing an online graphing game. Learners will discover why it is useful to plot coordinates on a xy plane. Graph Mole, is the online game that allows them to practice through a fun, interactive story....
Curated OER
Birds, Fractions and Percentages
Students study fractions, percentages, spreadsheets, and computers by watching and recording the number of species of birdsseen. They create a spreadsheet to record the results of their one month study.
Curated OER
What's the Scoop?: Our Favourite Ice Cream Flavours
Sixth graders create a spreadsheet on the favorite ice cream flavors of their peers. They interview their classmates, documenting their findings on a "Favorite Flavors" spreadsheet. Students graph and analyze the data.
Curated OER
How Many?
Middle schoolers explore and design ways to collect data through simulations and random samples. They perform two experiments to determine the answers to various probability problems, and present the data/graphs in the form of a...
Curated OER
Know Your Angles
Explore types of angles and the characteristics of each. After observing a PowerPoint Presentation, learners tour the school facilities and use a digital camera to capture prescribed angles. Using the digital pictures and written...
Curated OER
Estimating Measurement
First graders estimate length and height of items. They read the story of Jack and the Beanstalk and discuss estimation of size. Students predict the length and height of figures. They use lines and numbers on the centimeter rod and tape...
Curated OER
Take It To the Bank
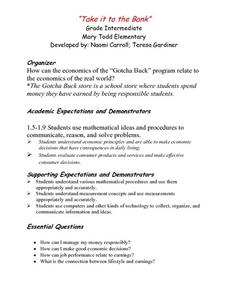
Examine how the economics of a school store relate to real world economics. Elementary students explore various websites, complete a Venn diagram, create a schedule of wages for the students, read the book "A Chair For My Mother" and...
NTTI
Vectors: Traveling, But in What Direction
High schoolers watch a video of real-world situations regarding speed, direction, velocity, force, etc. and answer questions while viewing. They then practice drawing and using vectors to solve more real-world problems.
Curated OER
Exploration of "Pillbugs"
Fifth graders define vocabulary terms, identify the characteristics of a pillbug, and create a dichotomous key. Then they examine the pillbugs and make observations and record these observations. Finally, 5th graders observe specific...
Curated OER
12 Days of Christmas
Students utilize different problem-solving strategies and creative writing when dealing with the words from the song, "12 Days of Christmas." They try to problem solve how may presents were given and then explain their sequence in the...
Curated OER
A Picture is Worth a Thousand Words
Pupils create various types of graphs. They go to suggested websites to collect data and create graphs to organize the data. Then they answer questions according to their graph.
Curated OER
Finding Equivalent Forms For Positive Rational Numbers
Learners discuss the relationship between and the equivalent forms of rational numbers. They will convert numbers from decimals to fractions, understanding they are equivalent, but just different forms.
Utah Education Network (UEN)
Subtracting Integers
Review the concepts of additive inverses and adding positive and negative integers. Relate understanding to the subtraction of integers. This is done with either the use of "Algeblocks" (any square or tile manipulative should do) or a...
Curated OER
Histograms
Young statisticians explore the concept of histograms. They construct histograms of various data such as change in a student's pocket, and guessing on a test. hHey analyze data represented as a histogram and a box plot and compare...
Curated OER
Representing Patterns & Evaluating Expressions
Write algebraic expressions, determine patterns, and evaluate expressions in a real-world context. Learners engage in a series of collaborative activities to identify, model, and give variables for real-world patterns. They write...
Curated OER
The "U's" Have IT!
Students explore the maximum and minimum values of parabola. In this exponential equations lesson, students use graphing calculators or TI Interactive Software to calculate values of parabola and graph x-intercepts of parabola.
Curated OER
How Many Frogs?
Students explore the concept of linear regression. In this linear regression lesson plan, students find the line of best fit for a set of data pertaining to a frog population. Students use their line of best fit to predict the frog...
Ohio Department of Education
I Can Do This! Systems of Equations
Use tables, graphs, and substitution to solve systems of linear equations. An envelope of sample problems is passed around the classroom, and each learner has the opportunity to solve the system in the envelope. This is a great way to...
Other popular searches
- Educational Technology Math
- Immigrant Math Technology
- Math Technology Projects
- Math Technology Triangles
- Math Technology Excel
- Computer Technology Math
- Surveys Math Technology
- Math Technology Lesson Plans
- Technology +Math
- Math Technology Lesson
- Gps Technology Math Science
- Technology Math Lesson Plan


