CK-12 Foundation
Slope-Intercept Form: Mountain Train
Hop aboard to learn about the slope-intercept form. Young mathematicians use an interactive to adjust the path a train takes up a mountain. A set of challenge questions helps them see the connection between key features and the...
CK-12 Foundation
Venn Diagrams: Planets and Dwarf Planets of the Solar System
Yes, Venn diagrams are helpful in science, too. Learners use an interactive to classify celestial bodies as having moons, as dwarf plants, as both, or as neither. They answer a set of challenge questions based on the Venn diagrams they...
CK-12 Foundation
Standard Form of Linear Equations: Seesaw
Don't hem and haw, learn about equations using a seesaw. An easy-to-use interactive has pupils move a seesaw on a coordinate plane to investigate the standard form of a linear equation. By completing a set of challenge questions, they...
CK-12 Foundation
Graphs of Absolute Value Equations: Absolute Value Distance
The sole purpose of this interactive is to graph a function representing the distance of a car from a shoe store. Scholars use an interactive to graph such an absolute value function. They then answer a set of challenge questions...
CK-12 Foundation
Inductive Reasoning from Patterns: Greeting with Handshakes
Greet this resource like an old friend. An interactive has users investigate the number of handshakes required for a group to greet each member. A set of challenge questions ensures that learners have a solid understanding of the...
CK-12 Foundation
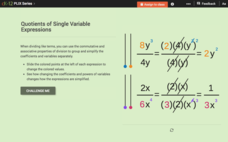
Simplify Products or Quotients of Single Variable Expressions: Quotients of Single Variable Expressions
Investigate division within an algebraic term using an inquiry-based lesson. Individuals adjust sliders and watch as the simplification of the term changes. Questions help guide them to important conclusions.
CK-12 Foundation
Function Rules for Input-Output Tables: Soda Sugar Function Table
Examine the relationship between the input and output variables in a table of values. As learners build an input-output table using online manipulatives, they begin to identify patterns. They answer questions about these patterns and...
CK-12 Foundation
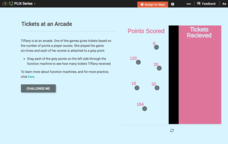
Function Rules for Input-Output Tables: Tickets at an Arcade
This is the ticket to learning about function rules! Using online manipulatives, scholars build a table of values and then answer questions about the related function. They examine the relationship between the input and output values and...
CK-12 Foundation
Input-Output Tables for Function Rules
How does changing a graph affect the function? Learners watch the changing input-output table as they adjust the location of the line graph. Questions prompt them to complete a table of values and determine the function rule.
CK-12 Foundation
Data Summary and Presentation: Chart for Grouping Data
Get social! Create a display of social media use for a class. Pupils use provided information about the time spent on social media to construct a histogram. Using the histogram, learners interpret the data to answer questions.
CK-12 Foundation
Single Bar Graphs: Cupcakes
What is a little cake among friends? Given the relationship between the number of cupcakes five friends have, pupils create a bar graph. The learners answer questions about the graph and adjust the graph if one friend shares some of his...
CK-12 Foundation
Types of Data Representation: Baby Due Date Histogram
Histograms are likely to give birth to a variety of conclusions. Given the likelihood a woman is to give birth after a certain number of weeks, pupils create a histogram. The scholars use the histogram to analyze the data and answer...
CK-12 Foundation
Understand and Create Line Graphs: Line Graphs
Explore line graphs and their characteristics through an interactive lesson. Scholars follow a set of directions to plot data on a line graph. They then answer questions about the type of variables, minimum and maximum values, and...
CK-12 Foundation
Line Plots from Frequency Tables: Sleep Cycles
Demonstrate the ease of using a frequency table. An interactive lesson allows learners to create a frequency table efficiently. Challenge questions ask your classes to analyze the data represented in the frequency table.
CK-12 Foundation
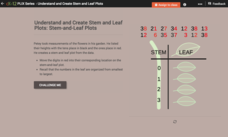
Understand and Create Stem-and-Leaf Plots: Stem-and-Leaf Plots
Explore the advantages to using a stem-and-leaf plot using an online lesson. Learners manipulate an animation to create a stem-and-leaf plot. They then calculate statistics for the data using their display. Guiding questions help them...
CK-12 Foundation
Create and Understand Box-and-Whisker Plots: Babies in a Waiting Room
Explore the strengths and weaknesses of box-and-whisker data display. An interactive lesson asks learners to create a box-and-whisker plot from a set of data. Challenge questions focus on determining what types of conclusions they can...
CK-12 Foundation
Proofs: Angle Pairs and Segments—The Three Angle Problem
Finding the sum of the measures of three angles is easy, unless you have no clue what the measures are. Learners use an interactive diagram to see a geometric problem in a different way. A set of challenge questions takes them through...
CK-12 Foundation
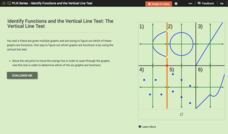
Identify Functions and the Vertical Line Test: The Vertical Line Test
There's no easier test than the vertical line test. Learners drag a vertical line across the graphs of several relations in an interactive. They answer a set of challenge questions that focus on whether the graphs represent functions.
CK-12 Foundation
Mode: Kittens
It is not as difficult as herding cats. The short interactive provides a group of kittens to sort according to their colors. Pupils determine the mode of the number of kittens by color. The questions continue with other numbers of...
CK-12 Foundation
Variance of a Data Set
Use variable value sliders to understand variance. The interactive shows four whole numbers, their mean and deviation. Using the information, pupils find the variance of the numbers and respond to question related to the understanding of...
CK-12 Foundation
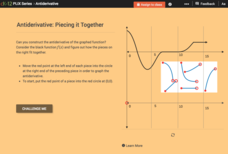
Antiderivative: Piecing it Together
Build a function backwards. Given a graph of the derivative of a function, pupils piece together a graph of the original function, the antiderivative. Learners use their graphs and the graphs of the derivatives to answer questions about...
CK-12 Foundation
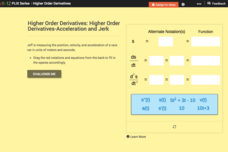
Higher Order Derivatives—Acceleration and Jerk
Accelerate your class through finding the second derivative. Using a bank of equations, pupils determine the equations for distance, velocity, and acceleration and their associated function notations. With the equations, learners answer...
CK-12 Foundation
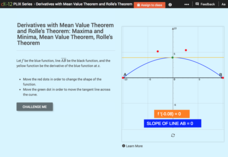
Derivatives with Mean Value Theorem and Rolle's Theorem: Maxima and Minima
Rolle with the mean values and derivatives. Scholars complete the statements of Rolle's Theorem and the Mean Value Theorem. Using the interactive to illustrate scenarios, pupils respond to questions concerning the theorems in terms of...
CK-12 Foundation
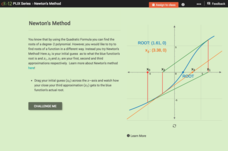
Newton's Method
Does the accuracy of the first guess make a difference down the line? Learners investigate the effects of the iterative process of finding roots, using Newton's Method. By moving the initial guess of a root on a graph, pupils observe the...


