Curated OER
Review Games
There are a multitude of games for reviewing almost any subject matter or lesson. The rules can be adapted to fit your own needs and levels. Most of these games have been borrowed from others and adapted. Football Review, Baseball...
Curated OER
Past and Present: Using baseball statistics to teach math
Learners use baseball cards to add up batting average and reinforce math skills. In this batting averages lesson plan, students use old baseball cards to practice different math skills and look at other baseball statistics.
Curated OER
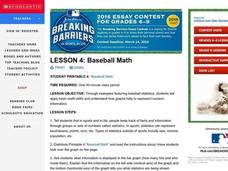
Baseball Math
Students collect data on baseball plays. In this statistics lesson, students graph their data and make predictions based on their observation. They calculate what the probability is that a favorable outcome would happen.
Curated OER
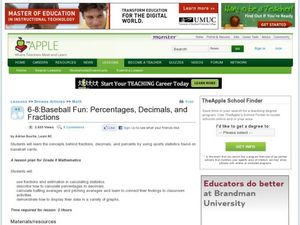
6-8 Baseball Fun: Percentages, Decimals, and Fractions
Students practice the concepts behind fractions, decimals, and percents by using sports statistics on baseball cards. In this baseball math lesson, students use fractions and estimation to calculate statistics. Students calculate batting...
Curated OER
Read a Picture Graph
It's the Bears vs. the Seals! Who is the season winner? Read this data and have your math class answer the six questions that follow. Consider graphing the chart as a class, or encouraging individuals to graph it before answering the...
Curated OER
Fantasy Baseball Team
Students create a database and use its ability to store, sort, and present information about their fantasy baseball team. They gather information and use their knowledge of statistics to accomplish their team.
Curated OER
How Much Has Math Changed?
Students solve problems using the opposite, reciprocal and powers. In this algebra lesson, students solve problems with inequalities and absolute values. They show understanding of the basic content of math in this lesson.
Curated OER
Baseball Geometry
Students apply various methods for finding the volume and surface area of sphere. They compare and contrast results among these mathematical methods. They work in cooperative groups to discuss their results with one another.
EngageNY
Creating a Histogram
Display data over a larger interval. The fourth segment in a 22-part unit introduces histograms and plotting data within intervals to the class. Pupils create frequency tables with predefined intervals to build histograms. They describe...
Curated OER
Lesson 6-7: Scatter Plots and Equations of Lines
In this scatter plot instructional activity, students examine tables and write a linear equation that matches the table. Students graph linear equations. They read scatter plots, determine the trend line, and write a linear...
K5 Learning
Force
Follow-up a physical science lesson with a reading passage that connects sports to force. Readers respond to six short answer questions that requires them to use the text as a basis for the answers.
Curated OER
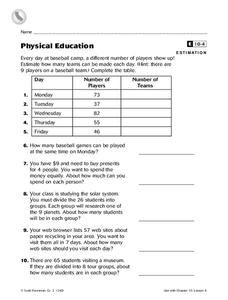
Estimation
Ten word problems provide practice in estimating. This worksheet is intended to accompany a specific text and lesson; however, it is useful without those resources.
Curated OER
Boomerang
Young scholars explore the concept of boomerangs. In this boomerang lesson plan, students throw homemade boomerangs at different angles to record maximum distance and if it returned or not. Young scholars collect their boomerang data...
Curated OER
Ag In The Outfield
Young scholars explore baseball. This is a cross-curricular plan that includes math, history, and agriculture. Pupils use their five senses to observe the materials a baseball is made from and identify the agricultural products used. In...
Curated OER
Does More Wins Mean More Fans At The Ballpark?
Pupils, after getting information from the past baseball season off the Internet, calculate an attendance-to-win ratio for each of the 28 major league teams and then study the results to see if winning always leads to good attendance.
Curated OER
Second Servings
Second graders understand the appropriate sizes for food portions. In this food groups instructional activity, 2nd graders create and measure a meal using correct portion sizes and correct measurements.
Curated OER
Agriculture Counts
Students understand the importance of counting in their lives.In this counting lesson, students participate in a counting agricultural goods activity. Students complete worksheets and understand why counting is important in agriculture.
Balanced Assessment
Fermi Estimates I
Enrico Fermi, the physicist responsible for the first nuclear detonation, was known for his ability to estimate with little or no data. Use this task to have your classes practice their Fermi skills. They estimate the magnitude of three...
Curated OER
America's Pastime
Students relate Newton's Laws of Motion to the game of baseball. They compare and contrast the materials used in baseballs that could affect their performance. They also determine how friction can be increased or decreased in a ballpark.
Curated OER
Cardboard History
Students investigate the history of baseball and create baseball cards based on research they have collected about early baseball players.
Curated OER
Dollars and Cents Word Problems
These are some cheap items! Learners explore cost with this addition word problem which has them examine the price of a baseball and a pencil. They add them together to find the total spent. Because there is an explanation below,...
Curated OER
Batting Practice: Using Math to Calculate Baseball Statistics
Students calculate and record batting average, hits, and at bats. In this Batting Practice: Using Math to Calculate Baseball Statistics lesson, students utilize mathematical formulas to determine the career statistics of baseball player...
Curated OER
Integration and the "Barrier Breakers": Black Baseball 1945-1960
Students explore integration of Major League Baseball, identify important individual baseball players who played key roles in integration, and analyze historical information through charts, graphs, and statistics.
Curated OER
Math League Baseball: Five Week Project
Eighth graders analyze how to use statistics, change fractions to decimal, and graph their statistics. They draft players from Major League Baseball eams and chose on player for each position, including 3 oufielders and one designated...


