Curated OER
Area Explorations
Young scholars explore the concept of area. In this area lesson, students find the area of irregular shapes with right angles. Young scholars break down each irregular shape into multiple regular shapes in order to find the area. ...
Curated OER
How to Round Numbers
Students exercise rounding numbers to the nearest tens, hundreds, and thousands. In this rounding numbers lesson, students participate in a rounding numbers activity, covering the concept of rounding in both addition and subtraction.
Curated OER
Gender and Income
Students investigate Income and gender preference. In this statistic lesson, students collect data of Income to see if one gender makes more than the other. Students examine the data and draw conclusions.
Curated OER
Money
Students speak and listen to different prices of items and complete a worksheet. In this prices lesson plan, students circle the correct prices on a sheet they are given based on the ones their teacher calls out.
Curated OER
Means of Growth
Students collect and graph data. For this statistics lesson, students analyze their plotted data using a scatter plot. They identify lines as having positive, negative or no correlation.
Curated OER
Estimation
Students complete computer activities about estimating if items are more or less than a given amount. For this estimation lesson plan, students also estimate measurements around the classroom.
Curated OER
Recycling for Raptors
Students write persuasive letters in support of the Recycling for Raptors campaign. They review raptor groups and names and categorize the raptor species and the groups which they belong. They research businesses, schools, and...
Curated OER
Probability
Sixth graders explore probability. They analyze a class chart and list the letters of the alphabet according to frequency. Using the data collected, they complete probability problems.
Curated OER
Mean, Median, and Mode
Students calculate the mean, median, and mode in a set of numbers. In this data analysis lesson, students put a set of numbers in ascending order and perform calculations to find the mean, median, and mode.
Curated OER
Falcon KWL Chart
Students create KWL charts about falcons. They write what they know about falcons and what they want to know about them. They read for information on falcons and complete the last column of their chart with the information they...
Curated OER
Track Your Trip
Fourth graders are shown how to read a map and identify key cities, landmarks, rivers, state boundaries, and train routes. They solve basic mathematical problems. Students reivew the componets of a map legend. They are asked to find...
Curated OER
Meet You at the Midden: Map Game
Students examine sketch map of Burrets' Trail at the Nightengale Archaeological Center, interpret map symbols to play game, and identify reasons people modify environment to meet their basic needs.
Curated OER
Calculating Your Travel GHGs
Students calculate the amount of greenhouse gases they produce in a given day. Using an equation, they determine the emissions for different sized vehicles and calculate the amount resulting from a family vacation. They create a class...
Curated OER
Expected Value
Students explore expected value, are introduced to the concept of varying payoffs, and have used a computer simulation of a "real world" example where expected value is used
Curated OER
Whistle Mixer
Students engage in an easy way to practice addition and subtraction skills while moving in different ways.
Curated OER
Regrouping With Remediation
Fourth graders complete multiplication, addition, and subtraction problems that all contain regrouping. In this regrouping lesson plan, 4th graders complete worksheets not provided.
Curated OER
Hurricanes in History:
Students interpret data displayed in a graph, make inferences based on graphical data. They work in pairs or groups to interpret graphs containing historical data of hurricanes, and then answer questions that assess their understanding...
Curated OER
Virtual Field Trip / Activity Research
Students visit a website to determine activities at three Michigan cities. They calculate the total cost of participating in the activities or visiting places such as zoos, planetariums, historic sites, and museums.
Curated OER
All Those Advertising Dollars!
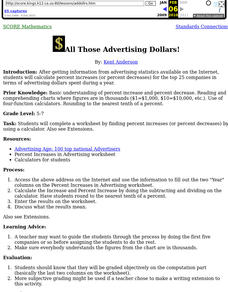
Students calculate percent increases (or percent decreases) for the top 25 companies in terms of advertising dollars spent during a year.
Curated OER
Calculate the Answer
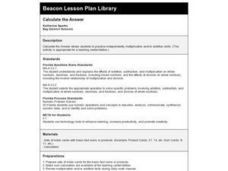
Students solve basic multiplication or addition facts using a calculator and product cards. They draw a card, read the sum or product, and press single digits on the calculator to display the number on the card.
Curated OER
Unexpected Answers
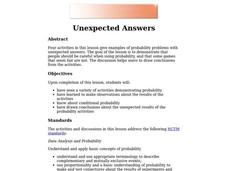
Students explore and complete a variety of activities demonstration probability. They make observations about the results of the activities. Students complete and discuss conditional probability. Also, students draw conclusions about...
Curated OER
Tantalizing Tessellations Lesson III: Creating a Slide Translation
Students watch and discuss an M. C. Escher video, use what they have learned to explain and apply their knowledge of tessellations in order to create a slide translation, present their findings in a 12" x 18" poster, and explore...
Curated OER
Venn Diagram Lesson Plan
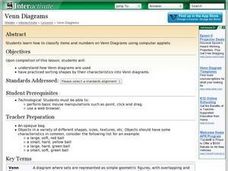
Students use Venn diagrams in order to classify different objects and numbers. They then use "Venn Diagram Shape sorter" applets on the computer.
Curated OER
Geometry in Tessellations
Students examine tessellations and their geometric properties. Students also develop a better understanding of lines, planes, angles, and polygons.


