Curated OER
Sports Lesson Plan
Have your class participate in a variety of sports and craft activities using this resource. With sports as the theme, learners work on art projects. Students create soccer ball prints, a three dimensional football, and a sports collage.
Curated OER
Computing Mean, Mode and Median
Ninth graders collect data on basketball player's heights and determine the mean, median, and mode for the data.
Curated OER
Making The Height
Twelfth graders apply estimation techniques to determine how high any one basketball player can jump.
Curated OER
Parabolas in Flight
High schoolers utilize a trajectory formula in order to discover the physics of a thrown ball. In this physics lesson, students videotape the trajectory of a thrown ball or basketball shot and analyze the action by breaking the video...
Curated OER
Not So Snappy 14
In this math worksheet, students read the word problems that are supposed to reinforce problems solving strategy skills. The skill of number sense is emphasized.
Curated OER
Find a Pattern
In this pattern worksheet, students use a table to solve a set of 3 word problems, then write their own problem using information in the table.
Curated OER
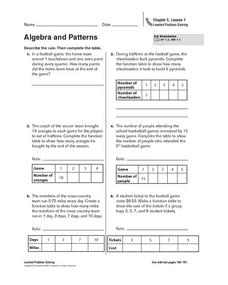
Algebra and Patterns
In this algebra and patterns practice learning exercise, learners sharpen their problem solving skills as they solve 6 story problems.
Curated OER
Relate Percents to Fractions and Decimals
In this relating percents to fractions and decimals practice worksheet, students sharpen their problem solving skills as they solve 6 story problems.
Curated OER
Bouncing Ball Experiment
Students collect data for a bouncing ball and select one bounce to analyze. They explore the relationship between velocity, position and acceleration. They seek out connections between the graphs and the physical motion of the ball.
Curated OER
Fruit Loops/Cheerios Activity: Measures of Central Tendency
In this measures of central tendency learning exercise, students use Fruit Loops and Cheerios to gather statistical data. They find the mean, mode and median of the data. Students construct a box-and-whisker plot of the class data. ...
Curated OER
Scatterplots
In this scatterplots worksheet, students construct a scatter plot from a given data set. Students then answer 4 questions regarding the least-squares regression line and making predictions.
Curated OER
Draw a Picture
In this subtraction worksheet, students solve one digit subtraction story problems. There are six story problems to solve.
Curated OER
Compare Numbers to 200
In this number comparison activity, 2nd graders compare two and three digit numbers to 200 in 6 word problems. They compare up to four numbers in each problem.
Curated OER
Practice Regrouping 15 to 18
In this adding and subtracting practice instructional activity, students sharpen their problem solving skills as they solve 6 story problems that require them to regroup.
Curated OER
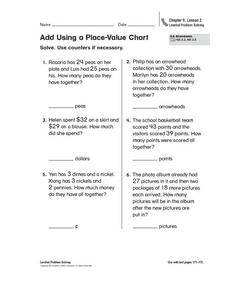
Add Using a Place Value Chart
In this addition practice worksheet, 1st graders sharpen their problem solving skills as they solve 6 story problems. They may use counters is necessary.
Curated OER
Simply Expressions
In this simplifying expressions practice worksheet, students sharpen their problem solving skills as they solve 6 story problems.
Curated OER
Negative Numbers on the Number Line
In this negative numbers on number lines practice activity, students sharpen their problem solving skills as they solve 6 story problems.
Curated OER
Represent Whole Numbers and Decimals
In this representing whole numbers and decimals practice worksheet, students sharpen their problem solving skills as they solve 6 story problems.
Curated OER
Counting Skills 2
In this counting skills worksheet, students examine 8 sets of pictures, count them, and record the number in each in of the sets.
Curated OER
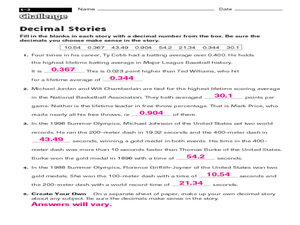
Decimal Stories
For this decimal worksheet, students fill in decimal numbers in a story, choosing from a "decimal box" at the top of the page, filling in blanks so that the story makes sense.
Curated OER
Graphing #4
In this graphing worksheet, students use data from a tally chart to create a graph of favorite sports and answer 4 related questions. A website reference for additional resources is given.
Curated OER
The Handley Sports Problem
In this probability worksheet, 11th graders analyze how many students participate in four different sports using the probability of an event ocurring. There are 4 questions on this worksheet.
Raytheon
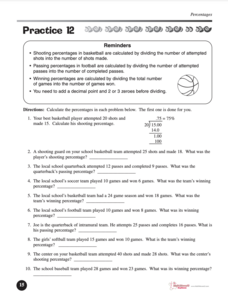
Percentages
In this percentages instructional activity, students complete percentage word problems dealing with money, division, fractions, and more. Students complete 54 problems.
Curated OER
Perimeter and Circumference
In this geometry worksheet, 10th graders are given shapes of rectangles and circles. They calculate the perimeter and circumference of the different polygons given values for the diameter or sides. There are 10 questions with an answer key.
Other popular searches
- Basketball Math
- Basketball Math Lessons
- Basketball Math Games
- Basketball Math Fun
- Basketball Math Activities
- Fantasy Basketball Math
- Basketball Lesson Plans Math
- Basketball Math Lessons Area
- Basketball Math Addition
- Ncaa Basketball Math
- Basketball Math Dribbling


