Curated OER
Who is Being Left Behind?
Students investigate scores as they relate to race. For this algebra lesson, students analyze standardized scores and how race can affect these scores. They plot their findings on a graph and draw conclusions.
Curated OER
Graphing Linear Equations
Students graph linear equations. In this algebra lesson, students investigate the price of tolls in different states and create a graph. They analyze their graph and draw conclusions.
Curated OER
The Fuelish Fact Finding
Students define fluctuation and the price of food. In this algebra lesson, students create a budget to live on based on their living expenses. They create a chart and explore the cause and effect of real life scenarios.
Curated OER
The Price Is Right
Students create a list of products with estimated prices. In this algebra lesson, students learn to write equations using variables. They match their created list with that of actual products and compare their prices,
Curated OER
Is This Fair?
Middle schoolers discover how to convert fractions to decimals and percents. They play the role of a shopper to complete this activity.
Curated OER
Variation
In this variation worksheet, students interpret and organize data. They find the distance between points. Students use ratios to determine volume This six-page worksheet contains approximately 20 problems. Answers...
Curated OER
Perimeter and Area
Fifth graders identify the area and perimeter of a rectangle. In this perimeter lesson, 5th graders use geoboards and rubber bands to construct various rectangles. Students use the formula to calculate area and perimeter of the...
Curated OER
Building Paper Bridges
Students construct a bridge that can hold 100 pennies. In this math lesson, students evaluate the strength of their bridges. They predict how much weight a bridge can hold based on its design.
Curated OER
View Tubes
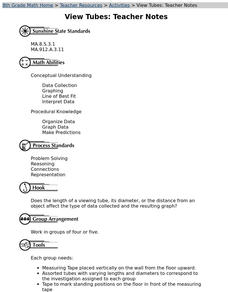
Eighth graders decide if the length of a viewing tube, its diameter, or the distance from an object affects the type of data collected and the resulting graph through a series of experiments.
Curated OER
Trends in Precipitation
Eighth graders study about precipitation and graph the information. They look for patterns in a scatter graph and make inferences based on what they see. They need to see a relationship between location and the amount of precipitation.
Curated OER
Confusing Colors!
Fourth graders collect data, graph their data, and then make predictions based upon their findings. They's interest is maintained by the interesting way the data is collected. The data collection experiment is from the psychology work of...
Curated OER
Statistical Accuracy and Reliability
Ninth graders assess the accuracy and reliability of current survey data and how it is represented. They design a survey, collect data, and use technology to analyze the data and present the results. Students examine scatter plots and...
Curated OER
M&M Exponential Activity
Students create a scatter plot of their experimental data. In this algebra lesson, students use M&M's to determine an algebraic model. They discuss results in class.
Curated OER
Lesson Plan On Fran Data
Seventh graders investigate the concept of functions and how they are used in the context of the real world while identifying the dependent and independent variables. They graph relations and functions and find the zeros of functions....
Curated OER
The Bigger they Are . . .
Students do a variety of data analyses of real-life basketball statistics from the NBA. They chart and graph rebounding, scoring, shot blocking and steals data which are gathered from the newspaper sports section.
Curated OER
Walking the Plank
Eighth graders experiment with a bathroom scale, books and a plank to determine how weight readings change as distance is applied. They graph and interpret the results.
Curated OER
A Functional Housing Market
Students access the Internet to search for housing prices in Houston, Texas,(the location can be changed to accommodate any location) and compare the prices to the number of square feet found in the living area of a house.
Curated OER
You Gotta Have Heart
Ninth graders investigate the concept of relations and interpret graphs and tables. They analyze given data and look for a pattern to determine if the numbers represent a function. Students practice solving scientific word problems that...
Curated OER
Calculator-Based Lessons Help Examine Real-World Data
Students may determine equations based on graphs and regression models.
Curated OER
Determining the Density of a Drop of Water-A Graphing Exercise
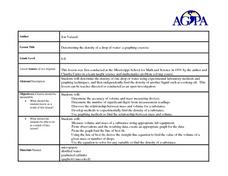
Students determine the density of 1 drop of water. In this determining density lesson plan, students determine the mass and volume of a drop of water in the lab using appropriate lab techniques and calculate the density of a drop of water.
Curated OER
Planet Protectors
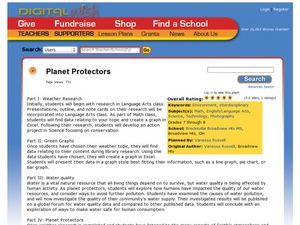
Middle schoolers explore ways to protect the earth. In this environmental issues and technology lesson, students investigate the water quality in their community and compare their findings to the water quality in other geographic...
Alabama Learning Exchange
The Composition of Seawater
Students explore the concept of finding the composition of seawater. In this finding the composition of seawater instructional activity, students make a saturated salt water solution. Students discuss why there is variation...
Curated OER
Story Problem Writing
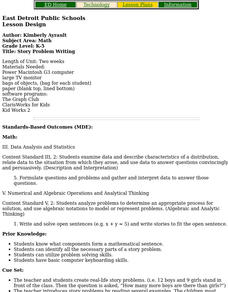
Pupils write story problems which can only be solved with the application of multiplication facts. They write an extra fact that isn't needed to solve. When their partners do the problems, they must cross out the fact that they do need.
Oswego City School District
Regents Exam Prep Center: Scatter Plots and Line of Best Fit
Use this lesson, practice exercise, and teacher resource in planning instruction on scatter plots and line of best fit. In the lessons, you'll find definitions and examples of ways to make a scatter plot, determine correlations, and find...


