Curated OER
Drops on a Penny
Eighth graders experiment to determine the number of drops of water a heads up penny hold. They create a stem and leaf graph of the class results and use the data for further experimentation on a tails up penny.
Curated OER
US Households
Learners construct and use inverse functions to model a real-world context. They use the inverse function to interpolate a data point.
Curated OER
Point Graphs
Students experiment with point graphs. In this math lesson, students are divided into groups and perform an experiment to see how high a ball bounces, recording their results on a point graph. Students then answer provided questions.
Curated OER
What's Your Shoe Size? Linear Regression with MS Excel
Learners collect and analyze data. In this statistics activity, pupils create a liner model of their data and analyze it using central tendencies. They find the linear regression using a spreadsheet.
Curated OER
Graphs and Transformations of Functions
Is it possible to solve quadratic equations by factoring? It is, and your class will graph quadratic equation and functions too. They perform transformation on their graphs showing increasing and decreasing intervals, domain, and range....
Curated OER
Discovering the Linear Relationship between Celsius and Fahrenheit
Students discover the linear relationship between degrees Farenheit and degrees Celsius. They manually compute the slope and y-intercept of the line passing through points. They convert Celsius to Fahrenheit degrees.
Curated OER
Rocketsmania And Slope
Students use a professional basketball team's data and graph it on a coordinate plane. They draw a line of regression and finding its equation. They access a website containing statistics for the Houston Rockets basketball team to solve...
Curated OER
Conductivity of salt Solutions
Students investigate the concentration level of solutions. In this math/science lesson, students identify three different ionic compounds. They predict the conductivity of each using their collected data.
Curated OER
How Do They Relate? Linear Relationship
Students collect information and use a line to represent it. In this algebra activity, students investigate real world data to see if it makes a line. They graph the line comparing the relationship of the x axis with that of...
Curated OER
Modelling Periodic Phenomena
In this Pre-calculus/Trigonometry worksheet, students determine the trigonometric function that best models the given data. The eight page worksheet contains explanation, examples, and twenty-one problems. Answers are not included.
Curated OER
Means of Growth
Learners collect and graph data. In this statistics lesson, students analyze their plotted data using a scatter plot. They identify lines as having positive, negative or no correlation.
Curated OER
Shaquille O'Neal Hand/Foot Span
Shaquille O'Neal has huge hands and feet, and learners will use those two measurements to practice collecting and extrapolating data using ratios. They record the measurement of foot and hand span of several of their classmates, then...
Houston Area Calculus Teachers
Area and Volume
An AP calculus lesson begins with an activity to determine the volume of a solid using a cross-section. Next, learners review the ways to find the area between two curves , as well how to find the volume of a solid created...
Curated OER
Drops on a Penny
Young scientists explore the concept of surface tension at is applies to water. In this activity, learners use a dropper to place drops of water on a penny. Each group guesses how many drops a heads-up penny will hold, then conducts the...
Mathematics Vision Project
Module 8: Modeling Data
Statistics come front and center in this unit all about analyzing discrete data. Real-world situations yield data sets that the class then uses to tease out connections and conclusions. Beginning with the basic histogram and...
Curated OER
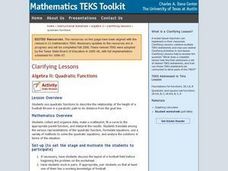
Algebra II: Quadratic Functions
Students collect and organize data, make a scatterplot, fit a curve to the appropriate parent function, and interpret the results. Students translate among the various representations of the quadratic function, formulate equations, use a...
Curated OER
The Way to Better Grades!
Pupils collect and analyze data. In this statistics activity, learners create a scatter plot from their collected data. They use, tables and graphs to analyze the data and mae decisions.
West Contra Costa Unified School District
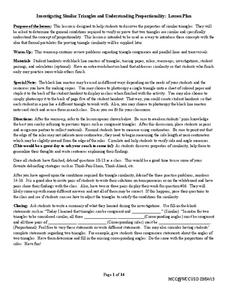
Investigating Similar Triangles
Let your use of the resource be in proportion to its usefulness. Pupils investigate similar triangles by measuring side lengths and considering given angle measures. The results of the investigation help develop generalizations about...
Curated OER
Tiling the Classroom
Students see how to identify regular polygons, how to slide, turn and flip polygons, and why certain polygons tessellate better than others. Groups create a one foot square design to be used to tile the classroom. Great instructional...
Curated OER
Handling Data: Representing Date - Online Version
Here is an online lesson plan on data representation. In it, learners access websites embedded in the plan which lead them through a variety of activities around data representation and statistics. The activities are quite good, and...
Curated OER
Translate Word Phrases and Sentences into Equations
Use this video to show your learners an example of how to translate word phrases into an equation to solve a real-world problem. The presenter begins with a review of how to use cross products to solve a proportion, including how to do...
Curated OER
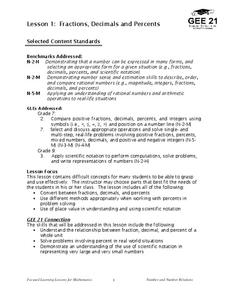
Fractions, Decimals and Percents
Students investigate the differences when using decimals, fractions, and percents. They focus on the process of using them in real problems and how to convert them from one form to another.
Curated OER
Seeing Is Believing
Students investigate the concepts of probability. They use data to find the central tendency, median, and mode. Students design and play a game in order to practice the concepts. They also complete a table with data that is analyzed.
Louisiana Department of Education
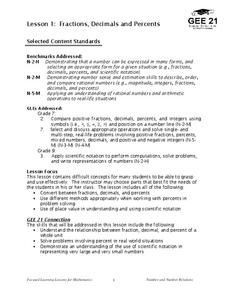
Fractions, Decimals, and Percents
Fractions, decimals, and percents all say the same thing! Show your classes how to convert between the three forms using visual and numeric representations. Then lead them to an understanding of scientific notation.


