Curated OER
Interpreting Graphs
Sixth graders interpret linear and nonlinear graphs. They create graphs based on a problem set. Next, they represent quantitive relationships on a graph and write a story related to graphing.
EngageNY
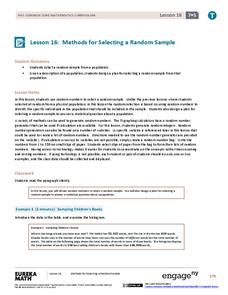
Methods for Selecting a Random Sample
Random sampling is as easy as choosing numbers. Teams use random numbers to create a sample of book lengths from a population of 150 books. The groups continue by developing a technique to create samples to compare from two populations...
District 158
Plan an Adventure
For kids, taking a vacation is all fun and games, but after completing this pre-algebra project, they'll have a whole new appreciation for the planning that makes these trips possible. Given a budget of $5,000 to spend on purchasing the...
Inside Mathematics
Graphs (2006)
When told to describe a line, do your pupils list its color, length, and which side is high or low? Use a worksheet that engages scholars to properly label line graphs. It then requests two applied reasoning answers.
Virginia Department of Education
Rational Functions: Intercepts, Asymptotes, and Discontinuity
Discover different patterns by making connections between a rational function and its graph. An engaging lesson asks scholars to explore the behavior of different rational functions. Groups discover a connection between the function and...
Noyce Foundation
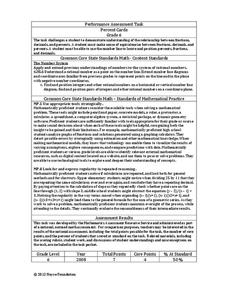
Percent Cards
Explore different representations of numbers. Scholars convert between fractions, decimals, and percents, and then use these conversions to plot the values on a horizontal number line.
Virginia Department of Education
Functions 2
Demonstrate linear and quadratic functions through contextual modeling. Young mathematicians explore both types of functions by analyzing their key features. They then relate these key features to the contextual relationship the function...
Virginia Department of Education
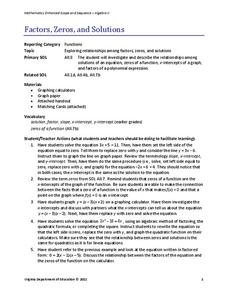
Factors, Zeros, and Solutions
Factors, zeros, and solutions, oh my! Don't let your classes become overwhelmed with the vocabulary. An engaging lesson plan helps learners make a connection between factors, zeros, and solutions. Pupils explore the relationship between...
Virginia Department of Education
Transformational Graphing
Find relationships between the structure of a function and its graph. An engaging lesson explores seven parent functions and their graphs. Learners match functions to their graphs and describe transformations.
Pace University
Grades 7-8 Mean, Median, and Mode
Take a central look at data. The differentiated lesson provides activities for pupils to calculate central tendencies. Scholars begin choosing three central tendency activities from a Tic-Tac-Toe board. Learners then choose from sports,...
Virginia Department of Education
Translate and Evaluate
Translate, evaluate, educate. Discover how to translate and evaluate expressions. Young mathematicians first review words and phrases that indicate operations and learn to write algebraic expressions from verbal descriptions....
Federal Reserve Bank
Income Taxes
Most adults dread April 15 — tax day! Tax preparation can be intimidating even for adults. Build confidence by leading individuals through the process and then give them a scenario to practice. The exercise uses tax vocabulary to give...
EngageNY
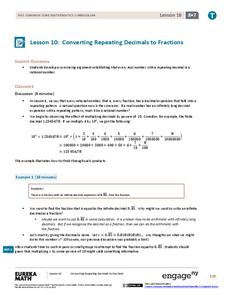
Converting Repeating Decimals to Fractions
Develop a process with your classes for converting repeating decimals to fractions. Through this process, pupils understand that any repeating decimal can be written as a fraction. The 10th instructional activity in this 25-part...
Teach Engineering
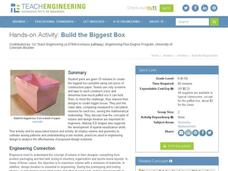
Build the Biggest Box
Boxing takes on a whole new meaning! The second installment of the three-part series has groups create lidless boxes from construction paper that can hold the most rice. After testing out their constructions, they build a new box....
Illustrative Mathematics
Setting Goals
Setting financial goals is a common occurrence in middle school that your learners can practice using this activity. They will be able to solve for how many hours Seth needs to work to save up for a skateboard, helmet, and trip. The...
Chemistry Collective
Virtual Lab: Textbook Style Limiting Reagents Problems
Time to test the limits! Young scientists make limiting reagent calculations and test their math using a virtual lab simulation. Using their knowledge of ionic compounds, they determine the limiting reagents and the excess compounds.
Curated OER
Range, Cluster, Gap and Outliers
There are a number of activities here where learners collect and record data, as well as, activities where the likelihood of an event happening is calculated given the experimental probability. Young statisticians organize information...
Shodor Education Foundation
Linear Inequalities
An interactive lesson helps individuals learn to graph inequalities in two variables. Scholars can adjust the interactive to present the inequalities in standard or slope-intercept form.
Shodor Education Foundation
InteGreat!
Take a great look at integration! Young scholars use an interactive to learn how to integrate a function. Learners input a function and view the integral as well as see a graphical representation.
Shodor Education Foundation
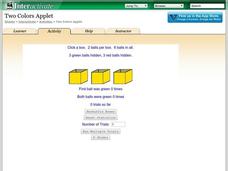
Two Colors Applet
Find the box with two green balls. The applet uses six balls, three green and three red, and hides them in three boxes. Pupils choose a box and click on it to reveal the color of balls inside. Using the chosen box, the simulation keeps...
Curated OER
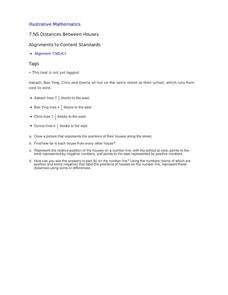
Distances Between Houses
This resource sneaks in the math so your learners will be adding and subtracting positive and negatives on a number line while thinking they are mapping out houses. The activity starts by putting houses the appropriate distance away from...
Virginia Department of Education
Surface Area of a Rectangular Prism
Wrap up a lesson on surface area with a resource that asks scholars to use the idea of wrapping paper to investigate surface area. They draw representations of rectangular prisms on graph paper to find the areas of the respective...
Virginia Department of Education
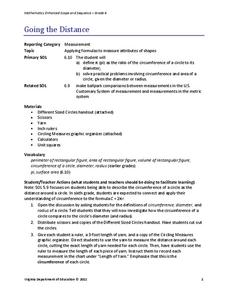
Going the Distance
Estimate the value of one of the most famous irrational numbers. The hands-on lesson plan instructs classmates to measure the circumference and diameters of circles using yarn. The ratio of these quantities defines pi.
Curated OER
School Fair Cakewalk
Students identify and research various suitable school carnival activities. Then they work together to plan, design, and run all aspects of a school carnival. Students also add up their costs for the event and the amount of money it...


