Curated OER
Areas of Polygons
Young mathematicians calculate the area of polygons in this algebra lesson. They find the determinant as they calculate the areas for triangles and quadrilaterals. They also use scalar multiplication to find the determinant.
Texas Instruments
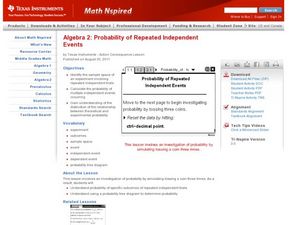
Probability of Repeated Independent Events
Statisticians analyze different samples to find independent and dependent events. In this probability lesson, pupils predict the outcome and then calculate the real outcome. They create a tree diagram to help predict the probability of...
Curated OER
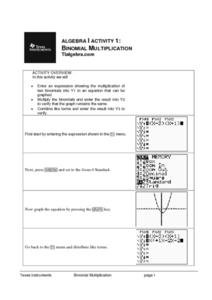
Binomial Multiplication
Learners explore binomial multiplication through the use of technology. Using a graphing calculator, you pupils enter the binomial expression into Y1, multiply the binomials and enter that result into Y2, and combine like terms and enter...
Curated OER
Perpendicular Bisector Theorem
High schoolers construct perpendicular bisectors using Cabri Jr. on their graphing calculator. They then construct conditional statements about perpendicular bisectors along with their converse, inverse, and contrapositive.
Curated OER
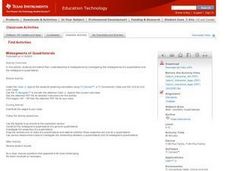
Midsegments of Quadrilaterals
High schoolers explore the concept of quadrilaterals as they find the midsegments of quadrilaterals using Cabri Jr. on a graphing calculator. They find midpoints, slopes, angles, and distances of lines and angles.
Curated OER
Conics in Geometry
High schoolers analyze characteristics and properties of two and three-dimensional shapes in this geometry lesson plan. They follow detailed directions to use the Cabri Geometry II Application on their TI-89 calculator to construct a...
Texas Instruments
A Tale of Two Lines
Learners graph systems of equation. In this calculus lesson, students graph their lines on a TI calculator. They identify the point of intersection and the type of solution.
Curated OER
Basic Limits
Learners calculate the limits of functions. In this calculus lesson, learners find the left and right handed limits of different functions. They use the Ti Navigator to drag the function around as they study limits.
Curated OER
Critical Points
Students identify critical points on a graph. In this calculus lesson, students graph their equations on the TI calculator. They zoom in and out to identify the critical points.
Curated OER
Local Linearity
In order to investigate local linearity, young scholars graph the function on the TI-calculator and zoom to observe the change in slope on the line. They incorporate technology to visualize these problems.
Curated OER
Calculus Inverse Derivative
Students solve equations using a given derivative. In this calculus lesson plan, students identify the rise of fall of each function. They use the calculator to find the derivative.
Texas Instruments
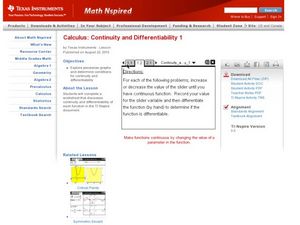
Continuity and Differentiability 1
Pupils examine graphs for continuity and differentiability in this calculus lesson plan. They observe piecewise functions to see where continuity and differentiability come into play. Learners finish by graphing their equation on the TI...
Curated OER
Riemann Sums
Students calculate the area under a curve. In this calculus lesson, students use Riemann Sums to find the area under a curve. They apply the boundaries of intervals as they solve for each area.
Curated OER
Solids of Revolution - Disks
Young mathematicians solve the volume using the disk method in this calculus lesson. They revolve a graph around the x-axis and calculate the volume. They use the TI to see the revolving around the x-axis and create a virtual cross...
Curated OER
Riemann Rectangle Errors
Students calculate the area under a curve. In this calculus lesson plan, students integrate the function to find the area under the curve. They use the Ti to create a visual of the graph.
Curated OER
Taylor Polynomial Examples
Students graph Taylor polynomials. In this calculus lesson, students relate accuracy of a Taylor polynomial to the degree of the equation. They graph their polynomials using the TI calculator.
Curated OER
Taylor Polynomials
Pupils graph Taylor polynomials in this calculus lesson. They observe the graphs for the expansion of Taylor polynomial functions and use the Ti calculator to help create visuals of the graphs.
Curated OER
Limit of a Sequence
Young scholars solve problems using limits in this calculus lesson plan. They calculate the solution to a problem by substituting in positive integers and relate the sequence output as it relates to the limit of a function.
Texas Instruments
Convergence of Taylor Series
Students analyze taylor series for convergence. In this calculus lesson, students analyze the graph of a taylor series as it relates to functions. They use the TI calculator to graph and observe the different series.
Curated OER
Polar Graphs
Students graph polar graphs. In this calculus instructional activity, students convert between polar and rectangular coordinates. They graph their solution on the TI calculator and make observations.
Curated OER
Name That Tune: Matching Musical Tones Through Waveform Analysis
Pupils detect the waveform of musical notes to determine the code for the "safe" in this forensics simulation lesson. They use a microphone and tuning forks along with Vernier EasyData on their graphing calculator to analyze five musical...
Curated OER
Midpoint of a Segment
Learners revisit midpoint and segments by graphing on the TI or computer. This activity can be done with pencil and paper, but is more interactive if it is done on a TI-navigator.
Curated OER
Using Cabri Geometry to Create Fractals
Learners construct the Sierpinski Triangle using Cabri Jr. They use a step-by-step guide to construct the Sierpinski Triangle on their graphing calculator and then discuss the formula for constructing a nth stage Sierpinski Triangle.
Curated OER
Classifying Triangles by the Length of the Sides Using Cabri Jr.
Learners follow detailed directions to create triangles on their graphing calculator. In this properties of triangles instructional activity, they will create triangles on their calculators using the Cabri Jr. application. They then...


