Curated OER
Integrated Algebra
In this algebra worksheet, students solve equations, graph linear functions and find the angles in triangles. There are 39 questions.
Curated OER
Lobster Roll!
Students collect data by playing a game that illustrates the delicate ecological balance between fishing, fishing regulations and fish populations. They graph and analyze the data and explain how economic decisions can affect the...
Curated OER
Presentation of Quantitative Data- Vertical Line Diagrams
In this quantitative data worksheet, students examine how vertical line diagrams can be used to display discrete quantitative data. They read about the use of tally charts to create vertical line graphs that display the data. They...
Curated OER
A Class Census
Students recognize that data represents specific pieces of information about real-world activities, such as the census. In this census instructional activity, students take a class and school-wide census and construct tally charts and...
Curated OER
Which Method Will You Choose? Finding Solutions to Systems of Equations.
Ninth graders investigate systems of linear equations. In this Algebra I lesson, 9th graders determine which method is the best for solving a systems: graphing, substitution, or elimination. Students choose a method and create a...
Curated OER
Global Statistics
Students determine statistics based on data. In this statistics lesson, students use data and record in charts. Students create graphs based on the statistics found.
Curated OER
How Long? How Wide?
Second graders distinguish between and use nonstandard and standard units of measurement, use appropriate tools and techniques to measure length and width, and record and interpret data using graphs.
Curated OER
Pumped Up Gas Prices
Learners calculate gas prices. In this transportation lesson, students tally the mileage and gas costs of their car for one months. They figure out how much was spent on gas and create a graph showing average gas prices over time.
Curated OER
Place Value
Third graders study the relationship between base 5 and base 10. They determine zero is a place holder and how to read and write base 5 numbers. They reinforce previously observed patterns in base 5 pieces. They choose another base and...
Curated OER
Shop 'Til You Drop
Students evaluate food prices. In this real world math lesson plan, students compare the cost of various grocery items to determine which is the best deal. They work in groups using grocery ads to decide how to get the most product for...
Curated OER
Musher Graphing and Probability
Students use the internet to research statistical information on the musher dogs participating in the Iditarod. Using the data, they create three different types of pie charts. They use the charts to answer questions about the dogs. They...
Curated OER
More Jelly Bean Math
Students use their color categorized jelly beans to find the range, mean, median and mode. They use their recorded data documenting how many jelly beans there are for each color in order to calculate the range, mean, median and mode of...
Curated OER
Math: Party Time!
Twelfth graders discover how to calculate the total costs for a party. They determine the unit prices of food and supplies, the quantities needed, and complete a chart displaying their findings. Students calculate the costs per serving...
Curated OER
A World of Information
Students analyze data and statistics about countries around the world. They read graphs and charts, color a world map to illustrate the top ten statistics about the world, and write a paragraph to summarize their information.
Curated OER
Measuring Soil Temperatures at South Penquite Farm
Learners investigate soil temperatures. In this graphing and earth science lesson, students insert temperature probes into different types of soil at varying depths. Learners complete a data chart and construct a related graph...
Curated OER
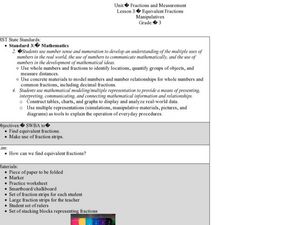
Equivalent Fractions Manipulatives
Students study fractions. In this equivalent fractions lesson, students utilize fraction strips to enhance their understanding of equivalent fractions. They watch a demonstration and then work independently with their own set of fraction...
Curated OER
Volume, Mass, and Weight
Study the difference between mass and weight. Your math group will compare the weight of an item to the amount of space that it uses. They'll then use conversion factors to find the difference between kilograms and pounds. Essential...
Curated OER
Positive Future Fair Project
Ninth graders view the film "Pay It Forward" and discuss what kind of public campaign is needed to move people to positive action. They consider different ways of presenting information (graphs, visual displays, etc.) as tools for...
Curated OER
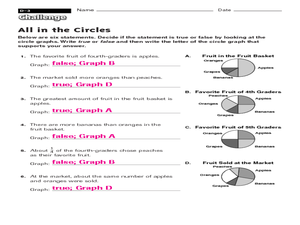
All in the Circles
In this circles worksheet, learners use 4 circle/pie chart graphs to answer a set of 6 questions. Answers are included on page 2.
Curated OER
M&M Caper
Students participate in a game with M&M's to be introduced to percents and ratios. Individually, they estimate and record the number of candies they believe the bag holds and the amount of each colored candy. They open the bag and...
Curated OER
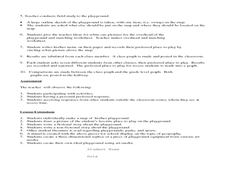
Where Oh Where on the Playground, Do I Love To Be?
Students listen to poem, Where Oh Where On the Playground, Do I Love to Be?, and practice reading, interpreting, and making maps, charts, and graphs in surveying classmates and discussing their favorite places to play in school playground.
Curated OER
An Encyclo-ME-dia for Every Child
Students create a digital scrapbook that shows information-text and pictures that are specific to each child. They make charts and graphs. They use digital cameras, scanners, software, to write captions, stories, poems, letters, and...
Curated OER
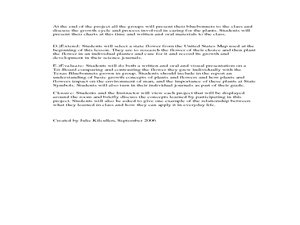
How Does Your Blue Bonnet Grow?
Learners explore the conditions needed to grow Texas Blue Bonnets. In this Blue Bonnet planting lesson, students recognize the differences in Texas Blue Bonnet. Learners record their findings in a graphs and analyze their results.
Curated OER
Cold Enough?
Students read and record temperatures and display the data. They represent the temperatures on an appropriate graph and explain completely what was done and why it was done. Students display the data showing differences in the daily...


