Curated OER
Handling Data: Comparing Distributions
Young scholars gather information by analyzing graphs, diagrams and pie charts. In this graphs and diagrams lesson, students complete addition and subtraction problems. Young scholars discuss a pie chart. Students use information to...
Curated OER
What's Your Favorite Planet?
Fourth graders interpret a graph and make correlations using data. After taking a class survey, 4th graders create a class graph of their favorite planets. Working in small groups, they interpret the information and create at least ten...
Curated OER
Cindy and Linda - Selling Lemonade
In this pie charts worksheet, learners use the pie chart to count how many glasses of Lemonade were sold by Cindy and Linda. Students complete the table and answer 3 questions.
Curated OER
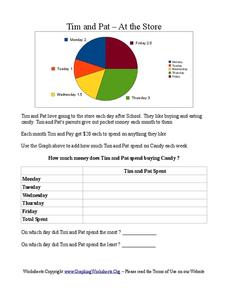
Tim and Pat - At the Store
In this pie chart activity, students use the pie chart to add the amount of time Tim and Pat spend buying candy each day of the week. Students answer 2 questions about the table.
Curated OER
Let's Go Shopping
In this fraction and pie chart worksheet, students draw a line from the toys with the prices of 50 cents, 75 cents, and 25 cents to the pie chart that show the part of a dollar the toy costs.
Curated OER
Walking Home
Middle schoolers discover the formulas for calculating distance. In groups, they solve equations determine the distance in a specific amount of time. They record their answers in a chart or graph and compare them with their classmates.
Curated OER
Data Shuffle
Middle schoolers find an advertisement or newspaper using charts or graphs. They create another graph using the same information in a different format. They write a comparison of the two graphs.
Curated OER
Finding the Flu
Students work to determine when the flu is most prevalent in the United States. They gather data on their own, create calendar, charts, and graphs, analyze their findings and present them. This is a very appropriate winter lesson!
Curated OER
Mathematics: Best Salary
Sixth graders pretend to need jobs to earn money for a go-cart which costs $1,000. They predict which of two scenarios raise the money first. they construct charts and graphs to demonstrate their predictions.
Curated OER
One, Two, Three...and They're Off
Students make origami frogs to race. After the race they measure the distance raced, collect the data, enter it into a chart. They then find the mean, median, and mode of the data. Next, students enter this data into Excel at which time...
Curated OER
Swimmy's Friends
Students solve problems using various strategies. For this problem solving lesson, students read the book Swimmy by Leo Lionni. Students make fish swimming patterns, measure how many goldfish crackers it takes to make a handprint and...
Curated OER
Law of Large Numbers - Hospital
Students explore concepts of probability and independent events. They develop a formula for deviation percentage.
Curated OER
Plastic Packaging
Students collect data. In this math instructional activity, students collect data about recyclable materials. Students develop a plan that will help the environment. Recycling plastic containers is discussed.
Curated OER
Candy Bar Survey
Second graders investigate the skill of graphing data by using candy bars to create context for the lesson. They use technology for graphing and organizing information like a spreadsheet. The lesson includes a resource link to aid in the...
Curated OER
Education for Global Peace
Fifth graders construct data graphs based upon sets of data. In this graphing instructional activity, 5th graders read the text If the World Were a Village and discuss how types of graphs accurately represent a large population. Students...
Curated OER
Making a Spreadsheet
Students explore spreadsheet software. In this personal finance and computer technology lesson, students develop a vacation spreadsheet on the computer. Students represent hotel, food, transportation, and entertainment costs on a graph...
Curated OER
Harry Potter Research Project
Young scholars work together to complete a research project on Harry Potter. They write a research question and develop a survey to give to their classmates. Using the results, they create a graph and draw conclusions about the data...
Curated OER
Leap Frog Experiment
Second graders ask questions and design an experiment to explore different spinners in "The Leap Frog" board game. They conduct their experiment, collect information and interpret the results using a graph.
Alabama Learning Exchange
Three in a Row Calendar Game
Students explore a calendar. In this calendar and math instructional activity, students view a video clip about using a calendar. Students participate in a game in which a game board is used to identify days of the week, dates, and months.
Curated OER
Putting Your Best Foot Forward
Third graders measure their feet and their parents' feet, record data on computer-generated graphs, and calculate and record mean, median, and mode.
Curated OER
Curiosity Does Not Kill The Cat
Students list the different ways they could test a guinea pig, a dandelion, and their brother (or sister)? They create a data chart in their group that lists the organism, what they could measure, and how they could change that measurement.
Curated OER
Picnic Possibilities
Fourth graders plan a picnic using weather data. Using accumulated weather data from various sources, they create a graph of the weather conditions in their region for a given period of time. Students interpret this data to predict the...
Curated OER
When Am I Ever Going to Use this?
Young scholars solve problems using equations and properties of integers. In this algebra lesson, students solve problems using ratio and proportion and graph their answers on a coordinate plane. They solve word problems using geometry.
Curated OER
Education for Global Peace
Students survey the class and graph the results. In this graphing and data collection lesson, students conduct a survey to see where their shirts were produced. Individuals use software to graph the results and create a written...


