Curated OER
Have You Heard It Through the Grapevine?
First graders, in groups, try to figure out which box of name brand raisins have more.
Curated OER
Virtual Field Trip
Learners calculate gasoline cost per mile on a virtual field trip. They calculate the gasoline costs and travel time for each of the 2 routes, and record on a data sheet. They use Excel to create data tables for mileage, gasoline...
Curated OER
Penguin Heights
Young scholars use the worksheet from the first website listed below to collect data on the penguin heights on the Penguin Page.
Curated OER
Coin Probability
Fourth graders, in pairs, receive three different types of coin bags. They pick coins out of the bag and tally what was picked fifteen times. They do it with all three bags for three separate tallies.
Curated OER
Closer To the Ground Lesson 2: Providing a Helping Hand
Students examine how businesses and corporations contribute or sponsor activities for the common good. They read annual reports of major corporations to determine how they contribute to focused activities for the common good.
Curated OER
Aeronautics Propulsion
Students use the World Wide Web to access additional information needed to complete the activities on the forces on an airplane, the function of the stabilizer, and the calculation of Mach speed, temperature, pressure, and thrust.
Curated OER
Perimeters, Patterns, and Conjectures
Students discover patterns and write conjectures relating to perimeters and polygons. Working in cooperative learning groups, they use manipulatives and graphic organizers to solve problems then answer a series of questions in which they...
Curated OER
Ohio Census 1990 & 2000
Students use Ohio census data to solve problems, make comparisons, draw conclusions, and support predictions related to Ohio's population. They interpret and work with pictures, numbers and symbolic information.
Curated OER
Energy Choices
Students add and multiply decimals to complete gas choice worksheets. They discover which gas supplier has the best gas prices. Students collect and interpret data about local natural gas suppliers and use this information...
Curated OER
Drip, Drip, Drip
Students gather scientific data and be able to utilize the data to generalize results over a long period of time. They use the appropriate tools to measure quanities of liquids and analyze the data to determine the cost of a leaky faucet.
Curated OER
Mother May I?
Third graders measure distance using nonstandard units of measure. In this measurement lesson, 3rd graders measure a given distance through the use of the game "Mother May I?" Student gather and compare data on how many "giant steps" and...
Curated OER
Passport to the Eastern Hemisphere
Seventh graders create a time line of significant dates in the history of their nation. This requires students to examine the entire history of a country and make informed judgments based on their historical knowledge.
Curated OER
Recording Treasure
Students participate in a garage sale. They will weigh the items sold. They will calculate the total weight of items sold and donated to an agency.
Curated OER
Cinderbank
Fourth graders identify major components of a "Cinderella" story in order to create a database.
Curated OER
Chessboard Challenge
Second graders read "The King's Chessboard" by David Birch. The teacher reads the story aloud and pauses at several points for students to calculate the next number in a pattern of doubling.
Curated OER
Pythagorean Theorem
Young scholars solve right triangles using the Pythagorean Theorem. In this solving right triangles using the Pythagorean Theorem lesson, students find the missing side of a right triangle. Young scholars find the hypotenuse given two...
Curated OER
Using 3-D Models for Code Validation with FoilSim
Students use FoilSim to complete the activity to create tables of data sets comparing the lift values for a 3-D model of a symmetrical wing section to the values predicted by the FoilSim software.
Curated OER
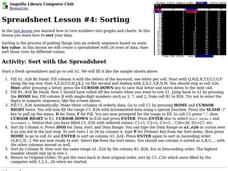
Sorting
Students examine how sorting is the process of putting things into an orderly sequence based on some key value. In this lesson plan students create a spreadsheet with 26 rows of data, then sort those rows by different values.
Curated OER
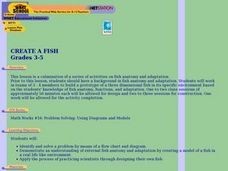
CREATE A FISH
Young scholars watch a video that helps shows them how a diagram, flow chart, or blueprint can help them create a 3-d fish with the correct anatomy to live in a realistic environment.
Curated OER
Using an Amortization Table
Students search the Internet to find a site that contains an amortization table and make a hypothesis about the results of changing time and rate. They examine the affects of time and rate on a mortgage and discuss the difference in the...
Curated OER
Saving An Endangered Species
Second graders work in groups in order to look at specific internet sites for animal adoption and sponsorship. They select an endangered species, determine needed funds, develop, advertise, and carry out a fund-raising plan.
Curated OER
Virtual Field Trip / Activity Research
Students visit a website to determine activities at three Michigan cities. They calculate the total cost of participating in the activities or visiting places such as zoos, planetariums, historic sites, and museums.
Curated OER
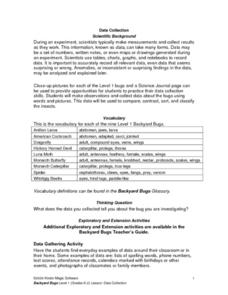
Science: Backyard Bugs Data Collection
Students practice data collection skills by observing common bugs found in their local environment. Once the data is collected they complete data sheets to compare, contrast, sort, and classify the insects. The lesson includes...


