Curated OER
The Way to Better Grades!
Pupils collect and analyze data. In this statistics lesson, learners create a scatter plot from their collected data. They use, tables and graphs to analyze the data and mae decisions.
Curated OER
Can You Count on Cans?
How can a canned food drive be connected to math? It's as simple as counting and organizing the cans! Children demonstrate their ability to sort non-perishable foods into categories that include soup cans, vegetable cans, boxed items,...
Curated OER
Water: From Neglect to Respect
The goal of this collection of lessons is to make middle schoolers more aware of the ways in which they are dependent upon water to maintain their standard of living. Learners compare water use in Lesotho to water use in the United...
Curated OER
Quarter, Nickel, Dime....
An engaging game called, "Quarter, Nickel, and Dime" is presented in this math lesson. Players are given an envelope with slips of paper that represent the three coins. In pairs, they play the game 18 times, and the whole class charts...
Curated OER
Hey, Pythagoras! Help Me Understand Your Theorem!
Learners explore the Pythagorean Theorem. In this math lesson, pupils solve problems using the Pythagorean Theorem. They select the appropriate numbers to substitute in the formula to solve problems.
Sri Atmananda Memorial School
Rising Water
An engaging, and not to mention attractive, lesson plan has prealgebra and beginning algebra scholars examining linear relationships. They consider the rising water level as a swimming pool is being filled. They do so by charting and...
Curated OER
Twelve Days of Christmas--Prediction, Estimation, Addition, Table and Chart
Scholars explore graphing. They will listen to and sing "The Twelve Days of Christmas" and estimate how many gifts were mentioned in the song. Then complete a data chart representing each gift given in the song. They also construct...
Regents Prep
Activity to Show Sample Population and Bias
There is bias in many aspects of our lives, and math is no exception! Learners explore provided data to understand the meaning of biased and random samples. The resource includes various data sets from the same population, and...
Code.org
Making Data Visualizations
Relax ... now visualize the data. Introduce pupils to creating charts from a single data set. Using chart tools included in spreadsheet programs class members create data visualizations that display data. The activity encourages...
Curated OER
Summer Body Activity: As Big as Me!
Learners explore things that are their size, literally. In this early childhood lesson plan, students use their bodies for measuring and comparing sizes as they work in pairs to complete the activity.
Curated OER
Jim, Tony, and Frank-The School Fund-raiser (Graphing)
In this graphing learning exercise, students view a pie chart. Students use their graphing knowledge to interpret the pie chart and answer ten questions. There is an answer sheet.
Curated OER
Piece of Pie Chart
In this math worksheet, young scholars examine a pie graph which shows a student's homework over 2 hours. Students read the information, then use a pie chart template (divided into 24 parts) to make their own homework chart.
Curated OER
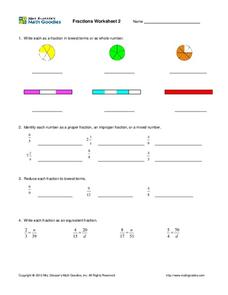
Fractions: pie graphs, numbers, and bars
In this fraction worksheet, middle schoolers complete fraction problems containing pie graphs, numbers, bars, proper fractions, lowest terms, and more. Students complete 19 problems.
Curated OER
Working Out The Workout: Chart Activity
In this chart worksheet, students complete one column in a chart to determine total hours of exercise time, then use the chart to complete 4 additional questions.
Curated OER
Weather Graphing
Every morning students complete the weather chart. They use colors to reflect the cloud cover and symbols for rain, snow, etc.
Curated OER
Make a Tally
In this tally chart activity, learners read the word problems and use the information within the problem to make a tally chart. Students use the tally charts to help them finish and solve the word problem.
Curated OER
Problem Solving and Puzzles: 3
Your class can use this to warm up or to discuss their problem solving strategies. They review the 8's times tables, relate the multiplication problems to division, then use a chart to solve a word problem involving money.
Curated OER
Data Chart
In this graphic organizer instructional activity, students use this blank data chart for any math or language arts purpose. There are 2 vertical columns on the chart with spaces for headings at the top.
Education World
The African American Population in US History
How has the African American population changed over the years? Learners use charts, statistical data, and maps to see how populations in African American communities have changed since the 1860s. Activity modifications are included to...
Curated OER
Organizing Data
In this organizing data worksheet, 7th graders solve seven different types of problems related to data. They first identify the type of data as categorical, discrete or continuous from the information given. Then, students use Excel to...
Curated OER
Ornithology and Real World Science
Double click that mouse because you just found an amazing lesson! This cross-curricular Ornithology lesson incorporates literature, writing, reading informational text, data collection, scientific inquiry, Internet research, art, and...
Curated OER
Mathematics Within: Bar And Pie Graphs
Students compare and contrast the use of bar and pie graphs with the same data. They create a data set by surveying all students in the class using sticky notes to make a table on the board. Then, each student creates a bar and pie graph...
Curated OER
Graph Lab
Seventh graders explore bar graphs and pie charts. Given a pack of M&Ms, 7th graders explore the colors, sort the data in a frequency chart and then construct bar graphs and pie charts to categorize the M&Ms by color. Students...
Curated OER
M&M Math
Pupils sort a bag of M&M candies according to color using a sorting mat. They count M&M candies. They compare the number to their prediction then students create tally charts.


