Curated OER
My Test Book: Stem and Leaf Plots
In this math skills worksheet, students solve 10 multiple choice math problems regarding stem and leaf plots. Students may view the correct answers.
Curated OER
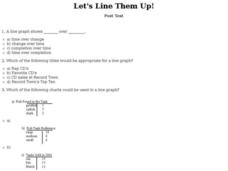
Let's Line Them Up! Post Test
In this line graphs worksheet, students answer multiple choice questions about line graphs. Students complete 10 multiple choice questions.
Curated OER
Critter Encounter Chart
Students record data found at an assigned web site. In this data collection lesson, students access an assigned web site in order to complete a data chart about animals they see. They travel to different sections of the web site to find...
Curated OER
Bias in Statistics
Students work to develop surveys and collect data. They display the data using circle graphs, histograms, box and whisker plots, and scatter plots. Students use multimedia tools to develop a visual presentation to display their data.
Curated OER
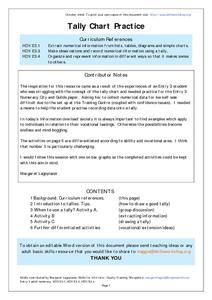
Tally Chart Practice
In this tally chart activity, students will read about tally charts and their uses. Students will make a list of when and why they could make a tally chart. Next students will complete a tally chart and write statements about the...
Curated OER
Stemmin'-n-Leafin'
Learners make stem and leaf charts to determine the measures of central tendency using test score data. They analyze the data to draw inferences which they share with the class. They complete the associated worksheets.
Curated OER
The Lake Effect
Fourth graders conduct an experiment demonstrating the effects of water and air temperature on precipitation. They create graphs demonstrating their findings using Claris Works for Kids.
Curated OER
Organizing and Interpreting Data
In this organizing and interpreting data activity, learners solve and complete 10 different problems related to reading various data tables. First, they complete the 3 charts shown with the correct tally amount, frequency amount, and...
Curated OER
Maps and Modes, Finding a Mean Home on the Range
Fifth graders investigate data from maps to solve problems. In this data lesson, 5th graders study maps and collect data from each map. Students present their data in a variety of ways and calculate the mode, mean, median, and range.
Curated OER
Student Costs Data Table
Students compare and contrast two routes selected for a virtual field trip. They create a data table of educational activities, lodging, and meal costs using Microsoft Excel software.
Curated OER
Generate Measurement Data Word Problems
Plot data for three word problems, each with a table of data. Learners create line plots for these, all of which have only single-digit whole numbers. The large text and few number of problems make this ideal as a whole-class warm up....
Curated OER
Calculate Percentages
Sixth and seventh graders study the concept of finding the percent of a number. They calculate the percent of any given number. Pupils describe ways to use calculating percents in their daily life, and change percents into decimals,...
Curated OER
Completing frequency diagrams from displayed data
In this frequency worksheet, students use data in graphs and charts to complete a frequency diagram. Students fill in 26 spaces in the diagram.
Curated OER
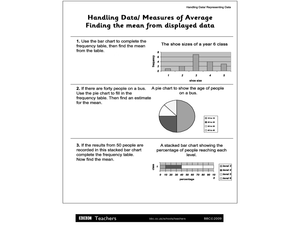
Handling Data/Measures of Average - Finding the Mean from Displayed Data
In this mean and average worksheet, students use the bars and charts to help them find the means using the given data. Students solve 3 problems.
Curated OER
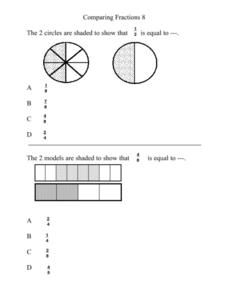
Comparing Fractions 8
In this elementary math worksheet, 5th graders compare fractions using a pie chart and practice finding the values in the multiple choice format.
Curated OER
Fore!
In this golf learning exercise, students fill in data in a chart about 6 tournaments and answer short answer questions about it. Students fill in 18 spaces in the chart and answer 2 questions.
Curated OER
Changing Fractions: Worksheet 1
In this math activity, students first write the fraction of the shaded area on the circles. Students then draw lines connecting markers on the perimeter of the circle and write the fraction using the new fraction that is shown.
Curated OER
Graphing
Fifth graders create graphs based on climate in South Carolina. They read and interpret information in a chart and construct a graphy from the information in the chart. They create a spreadsheet using Excel and publish 2 graphs.
Curated OER
Delicious Graphing
Fourth graders sort trail mix by type and use that information to create different types of graphs for comparing.
Curated OER
Meatiest States: Graph Problem Solving
For this graph problem solving worksheet, learners analyze a graph that shows commercial red meat production in five states. Students answer 5 word problems using the data on the graph.
Curated OER
Graphing Data on Ellis Island
Third graders use data to make a bar graph. In this graphing and social studies lesson, 3rd graders use data about where Ellis Island immigrants came from to complete a bar graph on Microsoft Excel.
Curated OER
Virtual Field Trip / Route, Mileage and Gasoline Cost Graphs
Students use a spreadsheet program to graph and compare milage, gasoline costs and travel time for two travel routes in their virtual field trip in Michigan. They determine the most economical route based on the graphs and calculations.
Curated OER
The Guise of a Graph Gumshoe
Eighth graders practice constructing bar, circle, and box-and-whisker graphs. They practice reading and interpreting data displays and explore how different displays of data can lead to different interpretations.
Curated OER
Graph Made Easy-Pre Test Questions
In this graphing pre test worksheet, students complete a set of 10 multiple choice questions. Page is labeled as a pretest, an answer link is provided.


