Curated OER
Lines of Best Fit
Students explore the concept of line of best fit. In this line of best fit instructional activity, students find lines of best fit in examples about riding your bike home from school and dentistry. Students find two data points and find...
Curated OER
Exercise Those Statistics!
Students participate in various activities, measuring their pulse rates and recording the data. They analyze the statistical concepts of mean, median, mode, and histograms using the data from the cardiovascular activities.
Curated OER
Mathematics In You
Learners construct ratios using the hand as data. They use examples of cortical and trabecular bone found in the long bones to measure circumference, diameter, length, and weight of long bones. They perform computations using growth...
Curated OER
Measuring to the Nearest Inch
Third graders use whole numbers and fractions to make connections between abstractions of the mathematical world and the real world. In this fractions and measurement lesson, 3rd graders identify, quantify groups , and measure distances....
Curated OER
Technology Integration Lesson Plan: Music Database
Eighth graders gather information on fifteen of their favorite songs, create database with fields representing different attributes, explore and sort their databases, and create charts and graphs showing amount of play time vs. popularity.
Curated OER
Plotting Wind Speed and Altitude
Students construct, read and interpret tables, charts and graphs. They draw inferences and develop convincing arguments that are based on data analysis. They create a graph displaying altitude versus wind speed.
Curated OER
Bug Hunt
Students strengthen observational skills by searching for insects in their home and classroom. In this observation lesson, students use magnifying glasses to classify what kinds of bugs were found. Students then create a bar graph to...
Curated OER
Fruit Shopping
In this fruit shopping worksheet, students are given pictures of various fruits to put in the shopping bags. Students read and interpret the given chart to know the correct amount of each fruit.
Curated OER
What Do We Do With A Dirty Bomb?
Students examine composition of dirty bomb and its possible effects on a city, and investigate simulations of such an event; students use computational and problem solving skills to assess damage and prepare report proposing solution to...
Curated OER
Handling Data: Representing Date - Online Version
Here is an online lesson plan on data representation. In it, learners access websites embedded in the plan which lead them through a variety of activities around data representation and statistics. The activities are quite good, and...
Curated OER
Awesome Animals
Students collect data from classmates about their favorite animal. They use the ClarisWorks graphing program to enter data, graph results, and interpret data.
Curated OER
A Day at the Beach
Student read Sheryl Wilson's story, "A Day at the Beach" while classifying items they find. They design a chart of the items before using educational graphing software to create a graph.
Curated OER
Buying My First Car
Students pretend they are about to buy their first new car. They must do all the calculations necessary to estimate the cost of purchasing the car. They see that the math they learn in school really does have real-life applications.
Curated OER
Blowing in the Wind
Pupils compare hurricanes and tornadoes. They write a paragraph explaining how to prepare for a storm. Students give an oral report. They use weather facts to practice math skills. Pupils record observations of a storm.
Curated OER
Weather Calendar
In this weather calendar worksheet, students read the calendar and identify the type of weather that occurred on that date. They also determine the total number of days that were cloudy, sunny, etc. There are 9 questions on this...
Curated OER
The Algebra Test Problem
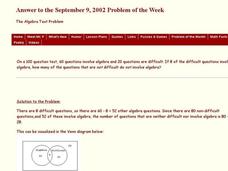
In this algebra test worksheet, students construct and interpret a Venn Diagram. They determine the type of algebra problems designated in the Venn Diagram. This one-page worksheet contains 1 problem. The answer is provided at the...
Curated OER
Regents High School Examination GEOMETRY 2009
The University of New York Regents High School Exam for geometry from August 2009 is comprehensive in scope with 38 questions over 22 pages. Geometers can assess their mastery of core content with a combination of multiple choice and...
Curated OER
Regents High School Examination: Geometry (June 2009)
The University of New York Regents High School Exam for geometry from June 2009 is comprehensive in scope with 38 questions over 22 pages. A reference sheet with relevant formulas is included.
Curated OER
Building Sets of 13 and 14
Compose and decompose sets of 13 and 14 and compare sets of each with your little learners. They use objects to construct sets of 13 and 14, record their answers, and compare sets in several different ways.
Curated OER
A Special Relationship
Young scholars discover the relationships of the lengths of the sides of right triangles and right triangles using a series of drawings on dot paper. They investigate and solve problems of standard (customary and metric units) and...
Curated OER
Getting Into Shapes: Identifying and Describing Two-Dimensional Shapes
Young scholars examine their classroom to find examples of various types of shapes. After identifying and describing the various shapes, they draw as many as they can on a piece of paper. They organize them into an image based on their...
Curated OER
Virtual Field Trip
Are we there yet? Young trip planners learn about their state and plan a trip. They will select sites to see in three cities in their state, and record associated costs in a spreadsheet. While this was originally designed as a...
Curated OER
Cover and Boarders
Students find the area and perimeter of rectangular figures. They use this information to find patterns and discover relationships between area and perimeter. Students apply and explain formulas relating to perimeter, area, and volume.
Curated OER
Cartogram of the Great Compromise
Students create cartograms of populations during 1790.


