Curated OER
Building Understanding of Rate of Change/Slopes Using Alice
Students explore slope as a rate of change. In this eighth grade mathematics lesson, students investigate real-world problems to determine rate of change and transform it into a linear representation, thus determining slope. Students...
Curated OER
Telling Time to 5 Minutes
In this second grade lesson your class will practice telling time. The goal is to tell time to five minutes using an analog clock. Your young students count by 5 minute intervals and discuss elapsed time.
Curated OER
Fire Wars
Your class can practice collecting and analyzing data. They extrapolate information and derive data from fire season statistics. They also choose the most appropriate format to display collected data.
Curated OER
How Do You Get to School?
Third graders talk about all the various ways they get to school. They make a list of all the bus numbers that the students use. They also list all the other methods of transportation used and solidify a hypothesis.
Curated OER
Count on Me
Fourth graders use inductive reasoning to find algebraic patterns in geometric figures. They use technology (i.e., calculators, computers) and manipulatives to discover number patterns involving geometric concepts. They solve concrete...
Curated OER
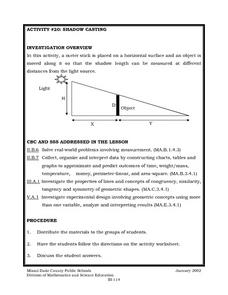
Shadow Casting
Eighth graders use a meter stick that is placed on a horizontal surface and an object is moved along it so that the shadow length can be measured at different distances from the light source. They solve real-world problems involving...
Curated OER
Chart Trivia
Learners practice addition and subtraction problems and answer questions using greater than and less than. They chart information to create a graph on the computer.
Curated OER
Groups Coming to America
Fifth graders use text or other references to locate different types of information about the Mayflower and pilgrims. They create a presentation for lower elementary classes about the Pilgrims.
Curated OER
Parts of a Whole
Fourth graders explore fractions through the analysis of various paintings. They view and discuss paintings by Picasso and Seurat, discuss the fractional examples in the paintings, and create a bar graph.
Curated OER
A Real Difference
Fifth graders use the Celsius and Fahrenheit thermometers to compare temperature readings. They use the Internet to find the temperatures of selected cities. After data is collected for five days, 5th graders graph the temperatures.
Curated OER
Which Color Will You Pick?
Students create a spreadsheet to chart the different colors found in a package of M&M's or Skittles. They collect data, create appropriate charts, and use percentages to describe quantities.
Curated OER
Ratios Through Social Studies
Students analyze and integrate mathematical concepts within the context of social studies. They gather, present and analyze information on a bar graph, pie chart, etc. Students compute ratios. They demonstrate that ratios have real-world...
Curated OER
An Apple A Day
Learners create a graph that showcases their pick for favorite kind of apple. Students are given samples of a variety of apples to determine their favorite in a taste test. They a create a tally chart of favorite kinds apples and use a...
Curated OER
The Great Turkey Walk
Students formulate questions that can be addressed with data and collect, organize, and display relevant data to answer them. They wcreate bar graphs and pie graphs
Curated OER
Voter Turnout
Pupils solve problems using math. They complete a graph, using data from the 2000 presidential election results. Students predict and calculate the outcome of the election based upon the voting patterns.
Curated OER
The Mathematics of Space and Place
Students investigate the measurements and geometry of the school grounds. They conduct inquiry while measuring the campus and some of the city blocks. Then students draw a map to scale and categorize property types using a pie graph.
Curated OER
Valentine Hearts
Students sort candy Valentine hearts into groups and create individual graphs.
Curated OER
It's Your Choice
Students compare data and determine the appropriate way to organize the data. They use physical graphs, pictographs, and symbolic graphs to display their data. In addition, they complete a Venn diagram.
Curated OER
"Favorite Fairy Tale Characters"
Third graders enter the results of their survey on a spreadsheet. They construct a bar graph showing the results.
Curated OER
Down by the Bay
Students listen to teacher read books about fish and participate in activities in order to explore how to identify bluefish. They count and graph the numbers of fish they find in simulated fishing activities.
Curated OER
We Are Having a Party! Part I
Second graders use data analysis skills in order to plan a class party. They graph possible times for the party noting the range for times. They discuss how mathematicians find and use the range to analyze data.
Curated OER
What's Your Favorite Stuffed Animal?
Second graders gather information in a survey and interpret the results using a tally chart, a table, and a bar graph. They' present their results of the during the final group discussion. The subject of the survey is favorite stuffed...
Curated OER
Heads-Up Probability
Second graders use tree diagrams to predict the possible outcomes of coin tosses. The data they collect and graph also help them predict the likelihood of getting heads or tails when tossing coins the next time.


