Curated OER
Go Yankees!
Students use the internet to research the New York Yankees baseball team. After gathering their information, they discuss the challenges faced by the team and how they were overcome. They end the lesson by examining the math and...
Curated OER
Problem-Solving Strategies in Word Problems
Students examine how to determine which strategy to use to solve word problems. In this word problem strategy lesson, students listen to a lecture on the process of using different strategies to solve math problems. They look at guess...
Curated OER
Working with Frequency Tables
In this Working with Frequency Tables worksheet, students analyze data that is organized in simple frequency charts. They calculate average from data presented in a frequency table, calculate a cumulative score, and identify data that...
Curated OER
Geoboard Area
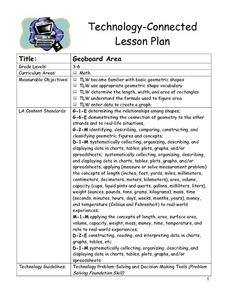
Students explore the basic geometric shapes and geometric shape vocabulary through the use of geoboards and virtual geoboards. They create a variety of shapes with a partner, build ten different rectangles on their geoboards, and...
Curated OER
Pond Theme Unit
For this pond theme worksheet students research facts on pond life. Students complete comprehension questions, crosswords, word search, and math puzzles. Students write a short report.
Curated OER
Michigan Virtual Field Trip
Students analyze data from a virtual field trip to Michigan. They conduct Internet research on mileage and travel time between cities, calculate and compare fuel costs, and research and calculate lodging, activities, and meal costs.
Curated OER
A Recipe for Air
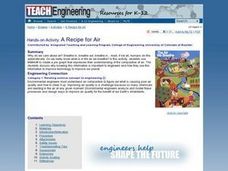
Learners create a pie graph using M&Ms to demonstrate the composition of air. They label each section of the graph, and list the fractions from largest to smallest.
Curated OER
Let's Trade
Second graders engage in a instructional activity which focuses on adding two-digit numbers and the regrouping process. They identify when the regrouping process is necessary and make appropriate "trades" to complete an addition problem.
Curated OER
Technology Blackout Day
Students describe the impact of modern technology inventions on daily life. They create a graph of the class's favorite item of technology and draw a picture of their favorite piece of modern technology.
Curated OER
Analysis of Atmospheric Conditions for a High Mountain Retreat
Students examine the relationship between altitude, atmospheric pressure, temperature and humidity at a particular location. They practice science and math in real world applications. They write reports detailing their scientific...
Curated OER
Shake, Rattle and Roll
Sixth graders explore the causes and effects of earthquakes. They also collect and analyze data in graphs. They also use the Internet to research earthquakes
Curated OER
Equivalent Fractions
Students complete a worksheet. In this fractions lesson, students review their knowledge of fractions, define equivalent fractions, see examples of equivalent fractions and practice making equivalent fractions.
Curated OER
Teenage pregnancy trends in Canada
Young scholars analyze demographic data relating to teen pregnancy trends. They develop skills to locate and interpret data. They discuss the factors that influence teenage pregancy such as social, economic, and educational issues.
Curated OER
Biomimicry, Nature: Architecture of the Future
Students explore the relationship between nature and architecture. In this cross curriculum history, culture, and architecture lesson, students observe and discuss structures visible in nature. Students view websites in which Native...
Curated OER
Hurricane Frequency and Intensity
Students examine hurricanes. In this web-based meteorology lesson, students study the relationship between ocean temperature and hurricane intensity. They differentiate between intensity and frequency of hurricanes.
Curated OER
Patterns Here, There, and Everywhere!
Upper graders access the Microsoft Word program and create patterns by utilizing certain keys on the keyboard. They create picket fences, smiley faces, and hearts. It seems that this lesson has as much to do with keyboarding skills as it...
Curated OER
Monthly Cost of Living - Food
Pupils determine how much they would need to feed a family for a month. They plan meals and use Internet grocery stores to find the cost of individual food items. They brainstorm in small groups to come up with 1 weeks worth of menus.
Curated OER
Learning About Graphics
Students practice using and filling in a spreadsheet. They also create graphs and charts that coorespond with the data. This is a unit comprised of four lesson plans.
Curated OER
Surname Survey
Students use data from the U.S. Census Bureau to determine whether last names in a local phone directory reflect the Census Bureau's list of the most common surnames in the country. In this surnames lesson plan, students use the Internet...
Curated OER
Range and Mode
Fifth graders interpret data. In this mode and range lesson plan, 5th graders define mode and range and practice finding them given a set of data.
Curated OER
Population Pyramids
Students create a population pyramid based on current data for their final project country. They analyze data from comprehension trends of final project country. Students analyze populations of specific countries.
Curated OER
The Seasonal Round and The Cycle of Life
Fourth graders are introduced to the concept of the seasonal round and how folklife traditions vary from season to season. They begin charting dates of personal interest on seasonal round calendars by starting with birthdays. Students...
Curated OER
Take Me Out To the Ball Game
Students use a map to graph and locate major league teams of different sports. In groups, they analyze the population data of the United States and compare it with the amount and location of the major league teams. They share their...
Curated OER
Teaching Percentages
Students calculate percentages using the Percent Tricks method. They multiply and divide whole numbers. They count total number of candies in a bag and calculate the percent of each color.


