Mathed Up!
Pictograms
Young mathematicians read, interpret, and complete a variety of real-world pictograms. Each question includes a key and information to complete the graphs.
Curated OER
Partitioning a Hexagon
The task at hand is to partition a hexagon into two, four, and eight congruent figures. Make sure to give your wizards a sheet of triangle grid paper on which to decompose the hexagons. Have them explain which rotations, reflections, or...
Curated OER
Best-Selling Books Bar Graph
Create a bar graph with your elementary school learners. First they read and interpret data, and then they color in the graph (provided) to indicate how many of each were sold. Consider providing them with the data but having them...
Curated OER
Graphing Greenery
Students gather leaves and trace them on graph paper. They plot coordinates that approximate the shape of the leaves and share those coordinates as "worksheets" for other students to complete.
Curated OER
Graph Frenzy!!
Students brainstorm for a survey question to ask classmates. They survey their classmates. They enter the results into a spreadsheet and create the best graph for the information. They share their graphs with the class.
Virginia Department of Education
Surface Area of a Rectangular Prism
Wrap up a lesson on surface area with a resource that asks scholars to use the idea of wrapping paper to investigate surface area. They draw representations of rectangular prisms on graph paper to find the areas of the respective...
Cornell University
Non-Newtonian Fluids—How Slow Can You Go?
Children enjoy playing with silly putty, but it provides more than just fun. Young scientists make their own silly putty using different recipes. After a bit of fun, they test and graph the viscosity of each.
Curated OER
M&M's and the Scientific Method
Sixth graders explore the scientific method by conducting an in class experiment. In this scientific averages lesson, 6th graders discuss the concept of the scientific method, and define the different mathematical averages, mean, median...
Curated OER
Collecting Data to Learn About the People Around You
Human graphs, anyone? Did you eat fruit today? What is your favorite costume? Have your K – 6 learners graph the responses. Early elementary grades may count and compare while upper grades compare responses of different groups or make...
Curated OER
Location on a Grid
Locating a point on a grid is an important skill to master; use this practice sheet to give schlars some clear and useful experience. On a large, simple grid they use a coordinate system to find specific squares and color them a given...
Curated OER
Call it "Macaroni"
Who knew there were so many fun educational opportunities featuring pasta? Scholars read a brief informational text about the history of pasta (note that "macaroni" is spelled two different ways, so address this if kids are reading...
National Security Agency
What’s Your Coordinate?
Your middle schoolers will show what they know with their bodies when they become the coordinate plane in this conceptual development unit. Starting with the characteristics of the coordinate plane, learners develop their skills by...
AIMS Education Foundation
Classroom Olympics
As the Summer Olympics are approaching, incorporate Olympic-type games into the classroom. From straw javelin to cotton ball shot put, these games are sure to keep leaners engaged. The best part is that there is math involved! Pupils...
Curated OER
Color Tile Graphing
Students explore data. They gather data and generate questions about the data in pictographs, tallies, tables, and bar graphs. Students use color tiles pulled by random to create their own bar graph. They discuss the bar graphs they...
Curated OER
Graphing Data Brings Understanding
Students collect, graph and analyze data. In this statistics lesson, students use circle, pie, bar and lines to represent data. They analyze the data and make predictions bases on the scatter plots created.
Curated OER
What is Your Favorite Christmas Light Color? Bar Graph Recording Sheet
In this opinion bar graph worksheet, students receive a number and record their preference of Christmas light color in the worksheet. They examine the colored boxes at the bottom of the page to make their choice. There are no directions...
Curated OER
Graphing Inequalities
Students graph linear equations and then find the person in class whose linear equation graph is perpendicular to theirs. In this graphing inequalities lesson plan, students graph their perpendicular slopes and then once their find their...
Curated OER
Chocolate Preferences Voting and Graphing Techniques
Students practice sampling and graphing techniques. In this data collection and interpretation lesson, students write and conduct surveys about chocolate preferences and then collect their data. Students graph the data in order to...
Curated OER
Collecting Data and Graphing
Learners practice collecting and graphing data using interlocking cubes. In this graphing lesson, partners count cubes and graph them. They also use a meter stick to measure arm span and height then compare the results with the class as...
Curated OER
Statistics of Mars
Young scholars explore the concept of central tendencies. In this central tendencies lesson, students sort M&M's or Skittles based on color. Young scholars graph their results. Students find the mean, median, and mode of their data.
National Research Center for Career and Technical Education
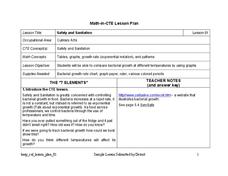
Safety and Sanitation
Your microbiologists explore the graphing of exponential growth functions using bacteria, like e. coli and salmonella, in a well-written, career and technology lesson.
Curated OER
Get the Picture with Graphs
Fifth graders examine line, bar and circle graphs in the newspaper and on the Internet. They complete sketches of graphs with an emphasis on selecting the best model to depict the data collected.
Curated OER
Organizing Data Using Tables and Graphs
Learners create graphs and tables, as well as interpret and make inferences from the data shown to determine when and where graphs and tables are most useful.
Curated OER
Creating Circle Graphs with Microsoft Excel
Pupils create graphs of circles. In this geometry lesson, students use Microsoft Excel to create graphs. They construct the graphs using paper and pencil as well as the computer.


