Curated OER
Graphing Pockets
Second graders explore graphing. They count the number of pockets on their clothes and use Microsoft Excel to enter their data. Students create a class graph displaying their findings.
Curated OER
Math Medicine
Young scholars solve real-world problems related to medical careers. They use graphical representations as part of the problem-solving process and work with fractions, decimals, exponents, and metric measurement. A demonstration is...
PHET
Radiation Hazards in Space
Young scientists race from Earth to Mars and back, trying to complete mission objectives while avoiding radiation in this game for 2-4 players. To identify the winner, players must graph their mission points and radiation points at the...
Lied Center of Kansas
The Ugly Duckling and The Tortoise and the Hare
Both The Ugly Duckling and The Tortoise and the Hare are great additions to an elementary language arts lesson. Young readers focus on the literary elements of each story, including characters and plot development, and apply...
Curated OER
Probability
Ninth graders engage in a lesson that is about the concept of probability using the context of recording data and predicting outcomes. They collect marbles while recording data and graphing it. The graph is analyzed and ideas are...
Curated OER
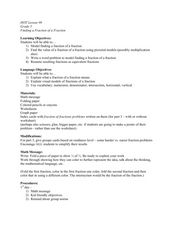
Finding a Fraction of a Fraction
Teach your math class to determine the value of fractions. The group will explore how to break a fractional part into smaller pieces, which helps strengthen their understanding of the part/whole relationship of fractions. A written...
Curated OER
Apples A Peel To Me
First graders gather, record and interpret data. In this math lesson plan, 1st graders collect data from their classmates regarding their favorite types of apples. Students use the data collected to explore the use of real graphs and...
Curated OER
Valentine Candy Count
Students analyze a bag of Valentine candy to create a graph. In this graphing lesson, students make predictions, sort by color, record data and make a graph. Students discuss results and make generalizations. Students generate their own...
Curated OER
Reflection: Student Worksheet
In this math worksheet, students will work independently to trace a stencil on an x-axis. Then students will follow a procedure to trace the image on the horizontal line of reflection. Students will observe that reflections and rotations...
Curated OER
Candy Colors: Figuring the Mean, Median, and Mode
Young scholars count candy by color and then calculate mean, median, and mode. They count candy and use the data to calculate mean, median, and mode (by color) and apply their learning to another collection of data.
Curated OER
Make a Design by Plotting Points
Students plot points on graph paper to make designs. They color their designs.
Curated OER
Chucky Chickadee's Bird and Breakfast: Sing in Please
Students observe bird feeding and complete a tally and graphing activity for their observations. In this bird graphing lesson, students work in teams to observe bird feedings. Students complete a bird reporting sheet and collect data...
Curated OER
Six Squares
Students create different shapes on grid paper. In this two-dimensional geometry lesson, students take turns outlining a shape made of six squares on the graph paper. They identify all shapes they see once everyone has had a...
Curated OER
Graphing With Second Graders
Second graders sort M & M's and then enter the data into a spreadsheet in order to create a simple graph. After printing the spreadsheet generated graph, have students compare the printed graph with their paper graph.
Curated OER
Delicious Graphing
Fourth graders sort trail mix by type and use that information to create different types of graphs for comparing.
Curated OER
Math and Cinderella
Students trace their feet and them compare the different sizes of classmates. They construct a bar graph showing the results of their classmates' feet size. They discuss what kinds of conclusions can be drawn from their observations.
Curated OER
Buzzy, Buzzy Bee
Students simulate honeybees pollinating flowers. In this pollination instructional activity, students role-play the process of pollination over the course of several seasons. Students graph results and share their graphs with the class.
Curated OER
Plant Systems
Second graders learn about plant systems and how plants grow and function. In this plant lesson plan, 2nd graders collect data based on roots, leaves, terrariums, plant uses, and locations of certain kinds of plants. They fill out...
Curated OER
Introducing Powers and Models
Students construct two dimensional models to illustrate squared numbers. In this geometry lesson, students use graph paper and an x/y axis to build squares exponentially. Students identify powers and relationships between various figures...
Curated OER
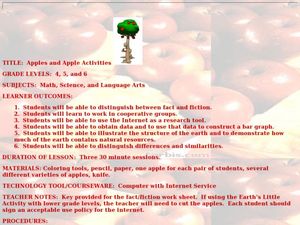
Apples and Apple Activities
Young scholars investigate apples. In this reading comprehension lesson, students read a book about apples then compare and contrast, make graphs, distinguish between fact and fiction and work in groups. Young scholars...
Curated OER
On the Seashore
Young scholars read the book On the Seashore and complete activities such as reading a book, color and cut out animal cards, model rock making, shell graphing, shell patterns, and more. In this seashell lesson plan, students use the...
Curated OER
Survey and Tally
Second graders view a model of a survey and tally. In this survey and tally lesson, 2nd graders decide on questions for a survey. Students conduct the survey and tally their results. Students create a tally chart....
Ms. Amber Nakamura's Mathematics Website
Algebra Project
What would your dream house look like? A cottage? A medieval castle? High schoolers enrolled in Algebra design the perfect house while using slopes to write equations for various aspects of the project.
Curated OER
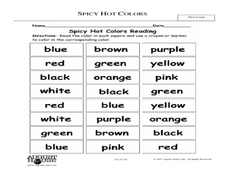
Spicy, Hot Colors
Students demonstrate an understanding of colors. In this visual arts lesson, students read the text Hot, Spicy Colors and name their favorite colors. Students complete a bar graph to show the data. Students discuss how each color can...


