Curated OER
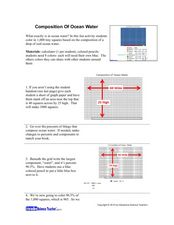
Composition of Ocean Water
Students experiment to determine the composition of ocean water. In this ocean water composition lesson, students color in a grid that shows the percentage of each of the components of ocean water which include chloride, sodium, sulfate,...
Curated OER
Centimeter Slinkies
Third graders estimate and measure the length of a whole color-segmented, candy gummy worm. Then, as students bite off each segment, they estimate, measure and record findings in an activity log.
Curated OER
Three Little Kittens: Addition Booklet
Students explore math problem solving strategies while reading a nursery rhyme. In this addition instructional activity, students learn math skills such as solving simple equations, graphing data and extending patterns while reading The...
Curated OER
Drip, Drip, Drip or The Case of the Leaky Faucet
Young scholars explore the cost of wasted water. In this math lesson, students conduct an experiment in which they collect data on how much water is lost when a faucet leaks. Young scholars figure the cost of the water that was wasted.
Curated OER
Wildlife
The centerpiece of this lesson plan is a predator-prey simulation in which colored paperclips represent different species of animals camouflaged against a colored background. Relevant follow-up questions are provided. The activity is...
Curated OER
Graphing the Daily Revenue of Miami Seaquarium
Seventh graders compile a table of the revenues of the 8 eateries (a combined total), Main Gate admissions, and the Gift Shop.
Curated OER
Math 6 - Act. 08: Patterns
Sixth graders use centimeter cubes to build structures and then compare and contrast the patterns they see.
Curated OER
Elementary Concepts in Heat
Third graders read a thermometer with accuracy, record observations and data, and infer conceptual meaning. They integrate mathematical charting and graphing skills to organize their data. They explore what happens when they touch or use...
Curated OER
Fractions in Action
Investigate equivalent fractions with your class. They compare and order fractions. Then they work cooperatively in groups to experiment and problem solve with fractions using a game format. Multiple resources are provided.
Curated OER
Plotting Amish Farmland
Second graders listen to the book, Down Buttermilk Lane by Barbara Mitchell. They discover how to read a grid and then together as a class, plot 2 squares, one yellow and one green. Then they plot the remaining squares independently and...
Curated OER
What Toothpaste Do You Use?
Students collect data about their favorite toothpaste and then graph the results of that data. They survey 15 of their friends to determine which toothpaste they use the most often and then color the graph to reflect the survey results.
Curated OER
We Are Having a Party! Part I
Second graders use data analysis skills in order to plan a class party. They graph possible times for the party noting the range for times. They discuss how mathematicians find and use the range to analyze data.
Curated OER
Learning to use and understand a database
Second graders were given a research paper and they were to answer the questions using the information found on the website. The website was a dictionary where the students would click on the letter to where they would go to find the...
Curated OER
Valentine Hearts
Students sort candy Valentine hearts into groups and create individual graphs.
Curated OER
Space: The Final Frontier
Sixth graders construct a graph to demonstration information that they've learned about the solary system. They also write or illustrate a sonar or lunar eclipse.
Curated OER
PASS the Arts
Students explore math and art concepts, create digital art examples of the concepts, and incorporate these works into a PowerPoint portfolio with explanation and analysis.
Curated OER
Transformations
Seventh graders complete activities to perform transformations of various figures and describe the transformations. In this transformations lesson, 7th graders perform a translation, a rotation, and a reflection on graph paper. Students...
Curated OER
Rich Kid Smart Kid Games
Students graph quantities to help explain the concept of pay yourself first, reinforce basic skills through the playing of bingo, and discuss the concept of charitable giving.
Curated OER
Displaying the Data
Students gather facts about their parent's families through the completion of parent interview forms. Using tally marks, the data gathered is counted, transferred to graphs and used to create family timelines.
Missouri Department of Elementary
Are You Balanced?
Balance scales create a strong visual of how an individual prioritizes one's self alongside their commitments to the community, school, and home. Scholars complete a graphic organizer then discuss their findings with their peers. A...
Curated OER
Reflection
Students examine how some transformations, such as reflections and rotations, do not change the figure itself, only its position or orientation.
Curated OER
Rise Over Run
Students define the slope of the line, find the slope between any two points on the line, and allow them to name other areas where the slope is used. They explain why the slope is defined as the rise over the run.
Curated OER
Probability
Students explore the concept of probability. In this probability lesson, students flip coins and draw marbles out of a bag to determine probabilities of a particular outcome. Students discuss the differences between experimental and...
Curated OER
I. M. Pei and the Geometry of the NGA
Students compare design elements in neoclassical and modern architecture. They review knowledge of triangles and quadrilaterals and design a geometric pattern using Pei's polygons They create a city plan using a variety of lines and...


