EngageNY
The Graph of the Natural Logarithm Function
If two is company and three's a crowd, then what's e? Scholars observe how changes in the base affect the graph of a logarithmic function. They then graph the natural logarithm function and learn that all logarithmic functions can be...
EngageNY
The Mathematics Behind a Structured Savings Plan
Make your money work for you. Future economists learn how to apply sigma notation and how to calculate the sum of a finite geometric series. The skill is essential in determining the future value of a structured savings plan with...
EngageNY
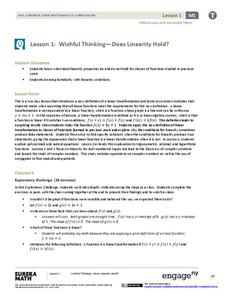
Wishful Thinking—Does Linearity Hold? (Part 1)
Not all linear functions are linear transformations — show your class the difference. The first lesson in a unit on linear transformations and complex numbers that spans 32 segments introduces the concept of linear transformations and...
Statistics Education Web
The United States of Obesity
Mississippi has both the highest obesity and poverty rate in the US. Does the rest of the data show a correlation between the poverty and obesity rate in a state? Learners tackle this question as they practice their skills of regression....
Statistics Education Web
I Always Feel Like Somebody's Watching Me
Future statisticians and potential psychics first conduct an experiment to collect data on whether a person can tell if someone is staring at them. Statistical methods, such as hypothesis testing, chi-square tests, binomial tests, and...
Statistics Education Web
Are Female Hurricanes Deadlier than Male Hurricanes?
The battle of the sexes? Scholars first examine data on hurricane-related deaths and create graphical displays. They then use the data and displays to consider whether hurricanes with female names result in more deaths than hurricanes...
Statistics Education Web
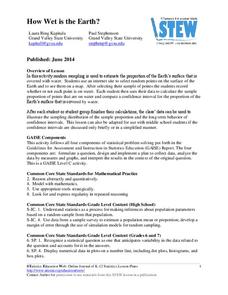
How Wet is the Earth?
Water, water, everywhere? Each pupil first uses an Internet program to select 50 random points on Earth to determine the proportion of its surface covered with water. The class then combines data to determine a more accurate estimate.
Statistics Education Web
Text Messaging is Time Consuming! What Gives?
The more you text, the less you study. Have classes test this hypothesis or another question related to text messages. Using real data, learners use technology to create a scatter plot and calculate a regression line. They create a dot...
Statistics Education Web
Types of Average Sampling: "Household Words" to Dwell On
Show your classes how different means can represent the same data. Individuals collect household size data and calculate the mean. Pupils learn how handling of the data influences the value of the mean.
Statistics Education Web
Consuming Cola
Caffeine affects your heart rate — or does it? Learners study experimental design while conducting their own experiment. They collect heart rate data after drinking a caffeinated beverage, create a box plot, and draw conclusions. They...
Statistics Education Web
Who Sends the Most Text Messages?
The way you use statistics can tell different stories about the same set of data. Here, learners use sets of data to determine which person sends the most text messages. They use random sampling to collect their data and calculate a...
Statistics Education Web
The Case of the Careless Zookeeper
Herbivores and carnivores just don't get along. Using a box of animal crackers, classes collect data about the injury status of herbivores and carnivores in the box. They complete the process of chi-square testing on the data from...
EngageNY
Translations
Learn through constructions! Learners examine a translation using constructions and define the translation using a vector. Pupils then construct parallel lines to determine the location of a translated image and use the vector as a guide.
EngageNY
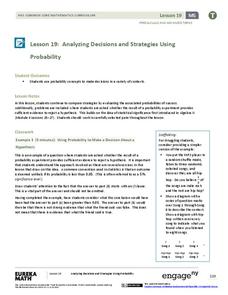
Analyzing Decisions and Strategies Using Probability 2
Explore how to compare and analyze different strategies. In the 20th installment of a 21-part module, scholars continue their analysis of decisions and strategies from the previous lesson plan. They then extend this concept to hypothesis...
101 Questions
100-Hand Video Poker
You hit the jackpot with a fun lesson! Peak your pupils' interest with a lesson calculating the probability of poker hands. A video shows the different types of possible hands when given a specific hand and one card to draw.
American Statistical Association
Bubble Trouble!
Which fluids make the best bubbles? Pupils experiment with multiple fluids to determine which allows for the largest bubbles before popping. They gather data, analyze it in multiple ways, and answer analysis questions proving they...
Other popular searches
- Common Core Math
- Common Core Math Lessons
- Math Common Core Lesson Plans
- Math Common Core Standards
- Common Core Kindergarten Math
- Common Core Math Fractions


