Curated OER
Linear Relations
In this linear relations worksheet, students complete a table for given functions. They classify graphs as linear or non-linear. Students graph given equations. They compare and contrast graphs. This nine page worksheet contains five...
Curated OER
Analyzing Graphs of Two Equations
Students analyze graphs of two equations. In this algebra lesson, students rewrite word problems as linear equations. They graph their solution and compare and contrast the two items being represented.
Curated OER
Mira, Mira on the Wall: Reflections
Learners investigate and perform reflections and symmetry. In this geometry lesson, students compare and contrast the relationship between reflections and symmetries.
Curated OER
MATH SHAPES
First graders identify the given math shape and then click and drag the shape name to the correct shape.
Curated OER
Beyond the Checkbook: Choices of Payment Methods
Students explore different payment methods. In this math lesson, students discuss the difference between writing a check and paying online. They will compare and contrast and present their data to the class.
Reading for Meaning
Sample Lessons and Worksheets
If you need to bulk up your reading comprehension worksheet collection, take a look at a resource that includes graphic organizers and reading comprehension questions. The series of 50 worksheets addresses novels such as Julie of...
Curated OER
Compare Fractions
In this mathematics activity, 3rd graders draw the fraction given and compare using greater than, less than, or equal to. Then they identify what they noticed about comparing two fractions when the denominators are the same.
Curated OER
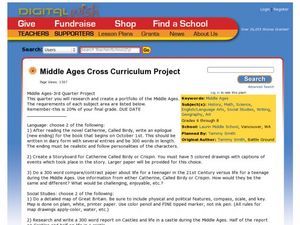
Middle Ages Cross Curriculum Project
Middle schoolers complete several projects on the Middle Ages. In this world history lesson, students complete language arts, social studies, math, and science projects. Some of these include: comparing a teenager's life now to that in...
EngageNY
Nonlinear Models in a Data Context
How well does your garden grow? Model the growth of dahlias with nonlinear functions. In the lesson, scholars build on their understanding of mathematical models with nonlinear models. They look at dahlias growing in compost and...
Illustrative Mathematics
Introduction to Linear Functions
Introduce your algebra learners to linear and quadratic functions. Learners compare the differences and relate them back to the equations and graphs. Lead your class to discussions on the properties of a function or a constant slope...
BW Walch
Creating and Graphing Exponential Equations
Frequently found in biology and economic application problems, exponential equations show up as stars in this introductory presentation. Taking no background or knowledge of exponentials for granted, the slides walk learners...
Mathematics Vision Project
Module 6: Quadratic Functions
Linear, exponential, now it's time for quadratic patterns! Learners build on their skills of modeling patterns by analyzing situations with quadratic functions. The sixth module in the Algebra I series has pupils analyze multiple...
Illustrative Mathematics
The Escalator, Assessment Variation
A great way to practice with unit rates, the activity gives your mathematicians an opportunity to compare different statements and select which are true. They can practice with "choose all that apply" by setting each statement into its...
Illustrative Mathematics
Riding at a Constant Speed, Assessment Variation
Practice ratios and unit rates with tracking how long Lin took to ride her bike. Provided with different questions, your mathematicians can assemble their answers using a chart or setting up ratios. The activity is included in a set of...
Willow Tree
Direct and Inverse Variations
Enhance pupil understanding of proportions and variable relationships by studying direct and inverse variation. Use the idea of a proportional relationship to teach direct variation. Then use a similar pattern to help individuals...
Willow Tree
Bar Graphs
Circles, lines, dots, boxes: graphs come in all shapes in sizes. Scholars learn how to make a bar graph using univariate data. They also analyze data using those bar graphs.
101 Questions
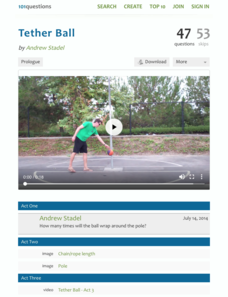
Tether Ball
All work and no play makes for a boring classroom! Bring back memories by analyzing the patterns of a tether ball. Given the dimensions of the ball, pole, and rope, young scholars must determine how many times the ball will wrap around...
Mathematics Vision Project
Module 10: Matrices Revisited
A matrix is just a fancy way of making a table. Young scholars explore operations with matrices with the first lessons in the final module of a 10-unit Algebra II series. After adding, subtracting, and multiplying matrices, pupils use...
Concord Consortium
Systematic Solution I
Writing a general rule to model a specific pattern is a high-level skill. Your classes practice the important skill as they write rules describing the solutions to a system of equations with variable coefficients. As an added challenge,...
Curated OER
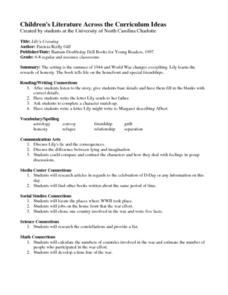
Lily's Crossing
Students listen to a story, "Lily's Crossing," about life during a World War. After completing worksheets, they compare and contrast characters in the story. Using math skills, students develop a time line of the war, calculate the...
Curated OER
My World - Africa Scavenger Hunt
Students explore the lives of students living in Africa, learn African traditions, and compare and contrast their lives with the lives of African Students.
Curated OER
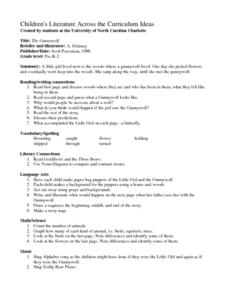
The Gummywolf
Students read a story about "Gummywolf," stopping periodically to answer questions about the progression of the story. Next, they create a Venn Diagram to compare and contrast "Gummywolf" to "Goldilocks and the Three Bears." Students...
Curated OER
Weather Pals
Learners study maps of the United States to locate weather pals from a list of schools. They communicate with Weather Pal schools through the use of closed circuit TV. Using weather data collected in their area, they exchange the...
Curated OER
Sort it Out
Learners identify and sort a variety of two- and three-dimensional objects and compare and contrast their attributes. They identify shapes, locate shapes on the faces of solids, sort real objects and explain the sorting rule, and...


