Virginia Department of Education
May I Have Fries with That?
Not all pie graphs are about pies. The class conducts a survey on favorite fast food categories in a lesson on data representation. Pupils use the results to create a circle graph.
Reed Novel Studies
Little House In The Big Woods: Novel Study
Author Laura Ingalls Wilder takes readers back to the good ole days. In Little House in the Big Woods, she tells scholars about a family living in the woods during the 1870s. While reading, they complete sentences with vocabulary words,...
Virginia Department of Education
Constructions
Pupils learn the steps for basic constructions using a straightedge, a compass, and a pencil. Pairs develop the skills to copy a segment and an angle, bisect a segment and an angle, and construct parallel and perpendicular lines.
Virginia Department of Education
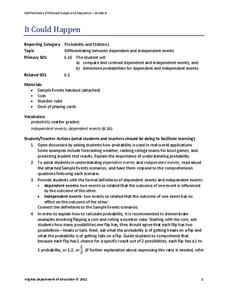
It Could Happen
Understanding of probability will probably increase with the use of a refined resource. Pupils learn to distinguish between dependent and independent events as they calculate the probabilities of these types of events in various situations.
Curated OER
A Biblical Perspective
Students analyze money using a Biblical and business perspective. In this algebra lesson, students define their money relationship biblically and in a business fashion. They compare their view with the view of someone in the Gold Rush days.
Curated OER
Biomimicry, Nature: Architecture of the Future
Students explore the relationship between nature and architecture. In this cross curriculum history, culture, and architecture lesson, students observe and discuss structures visible in nature. Students view websites in which Native...
Curated OER
Nutrients by the Numbers
Learners read and discuss an article on the amount of sugar in various food products. They compare the nutritional values of food products, calculate their daily intake of nutrients, analyze serving sizes, and compare/contrast their own...
Curated OER
Making Healthy Food Choices
In this well-designed nutritional activity, students are given the opportunity to create their own daily food record, compare their nutrient with minimimun requirements, and think critically about their own food choices. Materials and...
Curated OER
Hearing Handicap
Students examine the effects of hearing loss. In this lesson on physical disabilities, students survey five older adults on hearing impairments. Students pool their data and compare their results with the results from other studies about...
Curated OER
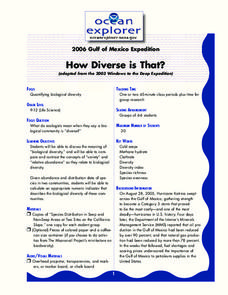
How Diverse is That?
Students discuss biological diversity in ocean communities. In this diversity lesson, students examine the variety of organisms compared to relative abundance. They will write an analysis and discuss their findings with the class.
Curated OER
Let the Rain Come Down!
Second graders construct a bar graph comparing local precipitation to that of the Yucatan. In this graphing activity, 2nd graders will use conversions and problem solving strategies.
Curated OER
Where We Live
Students make a 'where we live' chart to find what's common and unique about where they live. In this living analysis lesson, students complete a chart about where they live.
Curated OER
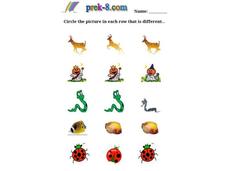
Differences 1
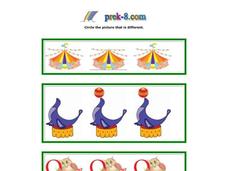
In this comparing differences worksheet, students study the three images and look for differences. Students then circle the picture in each row that is different.
Curated OER
Differences 4
In this comparing pictures worksheet, students study the two pictures in each set. Students then circle the picture that is different.
Curated OER
Who Has Denser Fur?
In this mathematics worksheet, learners identify and solve who has the denser fur, either the Sumatran tiger or the sea otter. They calculate the number of hairs for each per inch or per meters and compare them.
Curated OER
Venn Diagram with Blocks
Fifth graders classify blocks according to their attributes. In this math lesson, 5th graders will identify attributes of blocks, sort them, then form the groups into a Venn Diagram, and write ratios using the attributes.
Curated OER
Measurements
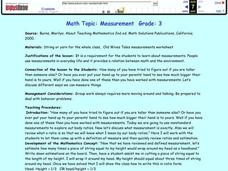
Third graders brainstorm a list how they use measurements everyday. Using string, they cut a piece long enough as their height and complete ratios using their arms and legs about old tales about measurements. They compare and contrast...
Curated OER
Even Or Odd Numbers
In this even or odd numbers worksheet, 7th graders solve 20 different problems by completing each sequence with the correct number. First, they circle whether the number is odd or even in the first 10 problems. Then, students write the...
Curated OER
Geo Jammin'
Students compare and contrast related two- and three-dimensional shapes, and complete a Venn diagram illustrating the attributes of each. Using a poem pattern from another lesson, students use data from the diagram to write an attribute...
Curated OER
Pi Digit Distribution
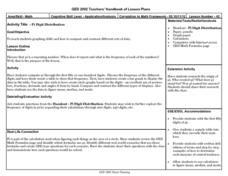
Students study graphing skills and compare and contrast data sets. They compute pi through the first 50-100 digits and create a bar graph showing the frequencies of specific digits.
Curated OER
The Many Faces of Coins
Students examine and discuss the designs on the circulating coins produced by the United States Mint. They read about the woman and child featured on the Golden Dollar. They compare and contrast coins using a Venn Diagram.
Curated OER
Weather Or Not
Young scholars use the internet to find pen pals to share in their weather experiment. Individually, they research the high and low temperatures for cities within the United States and email the results to their pen pal. They also...
Curated OER
Area graphics for 7th graders
Students randomly select dimensions for three geometric shapes (square, right triangle and circle). From the graphs they compare and contrast the graphical results of each shape.
Curated OER
Build and Test
Learners display what they have learned about bridges as they construct their bridge. They present their projects to the rest of the class. They compare and contrast the construction of the bridges.


