Curated OER
Collecting Data to Learn About the People Around You
Human graphs, anyone? Did you eat fruit today? What is your favorite costume? Have your K – 6 learners graph the responses. Early elementary grades may count and compare while upper grades compare responses of different groups or make...
K-5 Math Teaching Resources
Venn Diagram Template
Prevent your students from making a disaster out of their writing journals while attempting to draw their own graphic organizer. Instead, use this perfectly proportioned template of a Venn diagram.
Curated OER
Comparisons
Explore number value with learners through playing cards. They examine sets of three cards, adding up the value and comparing it to another set of three. Learners write in which is greater than or is less than to show number value...
Discovery Science Center
Kindergarten Observing, Comparing and Contrasting
Although this is a science lesson, it can be adapted to help meet Common Core standards in math as well. Starting scientists describe physical properties of objects and explore three forms of water. To address the Common Core, they can...
Curated OER
MUD-A Walk
Students investigate their tracks to determine the number of footsteps it takes to travel the entire length of their bodies. Then they determine the taller of two children and the shorter of two children with their tracks. Students also...
Curated OER
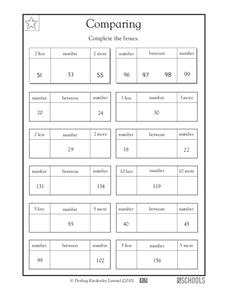
Comparing
Examine short number sequences to help scholars explore value comparisons. They look at various given numbers (both two-digit and three-digit) and write in values that are less or more by specific one-digit numbers (i.e. three less, two...
Virginia Department of Education
Growing Patterns and Sequences
Learners explore, discover, compare, and contrast arithmetic and geometric sequences in this collaborative, hands-on activity. They build and analyze growing patterns to distinguish which kind of sequence is represented by a set of data...
Curated OER
Decimal Problems
In this decimals worksheet, students solve 18 different types of problems that include both decimals and non-decimals. First, they subtract the measurement problems given both in metric units and in US units. Then, students subtract the...
Curated OER
Compare and Contrast
Students graph equations using the y-intercept. In this algebra lesson, students investigate functions based their slope and y-intercept. They learn to analyze graphs by comparing the y-intercepts of the graphs.
Curated OER
Prisms, Pyramids, and Nets
Students compare and contrast the characteristics of prisms and pyramids. In groups, they are given different colored construction paper to make rectanglar prisms. They identify the shapes of the faces and record the number of faces,...
Curated OER
Choose a Graph to Display Data
In this math graphs worksheet, students write line plot, tally chart, pictograph, or bar graph to tell the best kind of graph to use to answer the six questions.
Curated OER
Real Math
Students explore careers that require math knowledge and solve real life math problems. As a class, they compare and contrast classroom math to real life math and explore the links between algebra, geometry and math skills used in...
Curated OER
Pizza! Pizza!
Third graders tally, sort, and organize pizza orders from monthly school sales. They create an advertising campaign to promote the School Pizza Sale, record the data in graph form, compare and contrast the tallies throughout the year,...
Fluence Learning
Writing About Literary Text: Pygmalion and Galatea
Is it crazy to fall in love with your own work, or is that the purest love of all? Compare two renditions of the classic Greek myth Pygmalion and Galatea with a literary analysis exercise. After students compare the similarities and...
EngageNY
Why Do Banks Pay YOU to Provide Their Services?
How does a bank make money? That is the question at the based of a lesson that explores the methods banks use to calculate interest. Groups compare the linear simple interest pattern with the exponential compound interest pattern.
Agriculture in the Classroom
A Holiday Tradition: Which Christmas Tree Will You Choose?
Different varieties of Christmas trees provide an interesting way to combine social studies, science, math, and technology. Class members not only research the history of the Christmas tree holiday tradition, they compare and contrast...
Curated OER
Compare Fractions Using Fraction Circles
Fourth graders practice ordering fractions using models and drawings. In this math model instructional activity, 4th graders utilize colored blocks and drawings to show an equal representation of given fractions. Students compare and...
Curated OER
Jazz and Math: Rhythmic Innovations
Students watch a segment of the PBS Ken Burns JAZZ documentary about Buddy Bolden creating the "Big Four." They compare and contrast the rhythms of marches and jazz based on the examples in the film, and explore notation, subdivision of...
Curated OER
I Wonder How Fast Manduca Grows Compared To Me
Students study the Manduca bug and its growth data. They look for patterns and compare their own growth rate to that of the Manduca.
Curated OER
That was Then, This is Now
Students compare and contrast data charts and statistics for food prices of now and in the past. In this food prices lesson plan, students answer short answer questions and calculate computations.
EngageNY
Variability in a Data Distribution
Scholars investigate the spread of associated data sets by comparing the data sets to determine which has a greater variability. Individuals then interpret the mean as the typical value based upon the variability.
Mathematics Vision Project
Quadratic Functions
Inquiry-based learning and investigations form the basis of a deep understanding of quadratic functions in a very thorough unit plan. Learners develop recursive and closed methods for representing real-life situations, then apply these...
Curated OER
Don't Bet The House On It!
Great real-world math application! Have the class compare and contrast their estimated home price and income data with actual data. In groups, they participate in simulations to discover how the housing market and mortgages operate....
Curated OER
Logistic Growth Model, Explicit Version
Via the concrete setting of estimating the population of the US, your algebra learners are introduced to a logistic growth model. Comparing and contrasting logistic, exponential, linear and quadratic models, to see which fits the data...


