Curated OER
The Night Before Christmas Graph
First graders graph their favorite The Night Before Christmas books. In this graphing lesson students listen to several versions of the the same story, The Night Before Christmas. The students each choose their favorite version and the...
Curated OER
Coordinating Coordinates
Third graders explore coordinate pairs and coordinate grids. They use a grid on which each letter of the alphabet is assigned a coordinate pair, 3rd graders decipher a coded message. Pupils compare coordinate pairs on a coordinate grid...
Curated OER
New: Fun with Fractions
Third graders determine that the larger the denominator the more parts the whole is being divided into. They use fractions to communicate and compare parts of the whole. They discover what the numerator and denominator of a fraction...
Curated OER
Multiplication: Determining the Weight of Multiple Objects
Seventh graders use their knowledge of multiplication and problem solving to determine the total weight of multiple objects. In this multiplication lesson, 7th graders weigh various manipulatives, record the weight, and use...
Curated OER
Fraction Conversion 2 (With Percents)
Fifth graders determine how to convert fractions, decimals, and percents. In this conversion lesson plan, 5th graders use an on-line applet to practice making these conversions. They review how to make the conversions in a whole class...
Curated OER
Developing the Concept Division
Students use manipulatives to explain the concept of dividing multi-digit numbers.
Curated OER
Shop 'Til You Drop
Students compare food prices to find the lowest unit price and make choices about where to shop and what to purchase on weekly items, cost comparisons and items needed. They collect grocery ads and weekly sale flyer's to expedite their...
Curated OER
Pocket Change
Students practice identifying coins and their values. In this money identification lesson, students play a game, where they toll a coin, determine the value, and compare totals to win.
Curated OER
Fair Shares
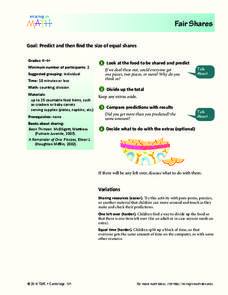
Learners investigate division by sharing food items with their classmates. In this division lesson, students are given a food item which they must equally share among the class using division. Learners predict how many portions people...
Curated OER
Shop 'Til You Drop
Students evaluate food prices. In this real world math lesson plan, students compare the cost of various grocery items to determine which is the best deal. They work in groups using grocery ads to decide how to get the most product for...
Curated OER
Measuring Up on the Mayflower
Second graders use a meter tape to compare the length of the Mayflower to a basketball court and make homemade butter for crackers. Afterward, all students sit inside the makeshift Mayflower's dimensions and enjoy their Pilgrim butter.
Curated OER
Kindergarten Exploration Tubs
Students identify their names as a symbol for themselves. They describe characteristics of organisms. They utilize tools to gather data and compare size.
Curated OER
Volume and Mass: Identify the Attribute
Students rotate through five studying stations related to the attributes of volume and mass. They manipulate objects to explore mass, compare two masses by pushing and lifting, pack materials and fill containers, and pour liquids from...
Curated OER
Then and Now
Learners conduct research and use census data to compare different times and places. In this census lesson, students interpret data from charts and graphs, comparing census information from two time periods as well as from two different...
Curated OER
Apple Estimation: Percentages & Subjective Reasoning
Students practice using their estimation skills by utilizing apples. In this percentage lesson plan, students utilize a scale and an apple to discover the percentage of each bite they take. Students share their data with the rest of...
Pennsylvania Department of Education
Use Order of Operations to Evaluate Expressions—No Grouping Symbols
Students identify and explain different types of data collection and graphs. In this graphs and data collection lesson, students record their observations of a variety of data collection tools and graphs displayed in the room. Students...
Curated OER
Basic Counting Principle
Young scholars find the number of possible arrangements of several objects by using the Basic Counting Principle. For this math lesson, students divide into groups and determine the number of possible sandwiches which can be made given...
Curated OER
Object Graphs
Students identify geometric shapes, demonstrate construction of an object graph, compare sets of objects, estimate which student has the most geometric shapes in his or her bag, and play computer game Jump Start Kindergarten.
Curated OER
Money in India: Comparison Shopping
Young scholars are exposed to a monetary system different from their own. They learn to exchange currencies between two monetary systems. Practice the necessary mathematical functions to find comparison. Compare prices of items sold in...
Curated OER
Handling Data
Students create a simple table in order to solve a problem. As a class, they create a simple data table in order to discover the number of letters in each student's name. This data is interpreted in order to answer questions and make...
Curated OER
World Statistic Day
Eleventh graders collect data about the state they live in. In this statistics lesson, 11th graders collect and analyze data as they compare themselves to students in other states. They analyze data about a person's education level, and...
Curated OER
Geoboard Squares
Students create squares of different sizes on a geoboard. They find and describe a pattern. Students use the pattern to determine the number of squares possible on a 10-by-10 geoboard. They create squares with a horizontal base (and...
Curated OER
Yummy Apples!
Students discuss apples and how they are grown. They listen as the teacher reads "Apples," by Gail Gibbons. Students discuss the story. They view several different types of apples and compare their characteristics. Students taste several...
Curated OER
Finding the Percent of a Number
In this mathematics worksheet, 6th graders find the percents of various numbers. They set up the problem, estimate, and write their response. Students also compare their answers to their estimates for each problem.


