Curated OER
Interactive Fractions
Students determine the common denominator of two unlike fractions. They practice adding fractions and finding equivalent fractions of numbers. They compare and contrast different types of equations involving fractions and construct...
Curated OER
Investigation - Peg Race
Students explore time by comparing the duration of an egg timer with how many pegs they can put in a pegboard. They experience one on one correspondence, as they place a peg in the whole. Students discover estimation of time and number...
Curated OER
How Do You Get to School?
Third graders talk about all the various ways they get to school. They make a list of all the bus numbers that the students use. They also list all the other methods of transportation used and solidify a hypothesis.
Curated OER
Writing Variable Expressions for Physical Models
Explore the concept of writing variable expressions by examining the similarities between expressions with numbers and expressions with variables. Emerging mathematicians determine rules for sequences and patterns before writing a rule...
Curated OER
Garden Scavenger Hunt
Second graders examine the metric system. In this metric system lesson, 2nd graders compare measurements of common objects in metric units. Students compete in a garden scavenger hunt.
Manchester University
Lesson 51: Scientific Notation
Discuss scientific notation with this mathematics lesson. Middle schoolers predict which problem is bigger of two numbers. They analyze the problems by observing the powers of 10 in order to decide which is bigger. This appears to be an...
Curated OER
Patterns
Explore early algebra by participating in a pattern identification activity using a random assortment of different household materials. The class creates, completes, and analyzes different patterns with the help of leggos, buttons,...
Curated OER
Application and Modeling of Standard Deviation
The first activity in this resource has learners computing the mean and standard deviation of two different data sets and drawing conclusions based on their results. The second activity has them using a dice-rolling simulation to...
Curated OER
Investigation - The Local Bagel Shop
Sixth graders investigate unit pricing to find which cup of coffee is a better buy. They use ratio and proportions to solve problems involving a change of scale in drawings, maps, recipes, etc. Students determine the unit cost of items...
Curated OER
Investigation-Looking at Polygons
Eighth graders plot points and investigate polygons. They locate a point, using ordered pairs of integers on the coordinate plane. Students compare geometric measurements and computations on coordinate axes as they are applied to...
Curated OER
Liquid Measurements
A clever visual known as "Measurement Man" is used to relate the number of units used to measure an object. Fourth graders fill in blanks with the correct numbers to show how many cups in a pint, how many quarts in a gallon, and other...
Curated OER
Capture/Recapture
Students use proportions to estimate the size of populations. They describe the data with using a graph or table of the estimate. Students use descriptive statistics to calculate mean, median, and mode. They also compare and contrast an...
Illustrative Mathematics
High Blood Pressure
Does watching TV increase one's blood pressure? Assess student understanding of how study design dictates whether a conclusion of causation is warranted. Use this as a prompt for a small group or whole class discussion, or as a part of a...
Curated OER
Working with Percentages
Learners complete basic operations using percentages in a variety of real world situations. Discounts are computed and compared to a variety of prices listed in local newspaper advertisements.
Curated OER
Counting Money and Making Change
Students count collections of coins and one-dollar bills. They solve problems and learn to use the dollar sign ($) with the decimal point to represent money amounts. This lesson is important as a foundation for future math concepts in...
Curated OER
We the People: A Study in American Voter Turnout: US Government
Students examine and compare voter turnout in US Elections. They write a letter to a favorite candidate or representative suggesting ways to increase voter turnout.
Curated OER
Inequalities 7.3
Graph inequalities and discuss the difference in their slopes. Learners observe rate of change as they compare linear, quadratic, and cubic functions.
Curated OER
The Number Line
Eighth graders investigate the order of numbers and how they are located on the number line. They also review the symbols used to compare quantities in order to decipher simple expressions and graph them on the numberline.
Curated OER
Sweet Fraction Frenzy
Fourth graders compare and order fractions. In this comparing and ordering fractions instructional activity, 4th graders make fraction strips from construction paper but pretend that they are candy bars. They use the strips to compare...
Curated OER
The Rabbit Problem
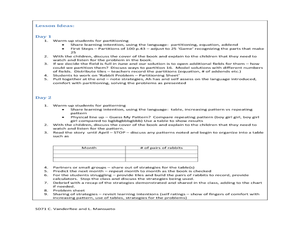
Students notice a number pattern in the book The Rabbit Problem by Emily Gravett. In this number pattern lesson, students represent and describe numbers appropriate to their grade level.
Curated OER
Equal Shmequal by Virginia Kroll
Pupils read a book and complete exercises to explore the meaning of 'equals.' In this equal numbers lesson, students brainstorm the meaning of equals and read a story about the topic. Pupils use manipulatives to study balance and equal...
Curated OER
Finding PI
Students select and use appropriate operations, methods and tools to compute or estimate using whole numbers. They develop and use formulas for determining the circumference and area of circles. Students determine and describe the...
Curated OER
Do You Have Number Sense?
Seventh graders are grouped according to their ability level with a captain who is elected by the students in that particular group. Students demonstrate their knowledge of rational and irrational numbers by defining them. Students use a...
Curated OER
Mean, Median, and Mode
Fourth graders compare two sets of data by using a double bar graph. In this data analysis lesson, 4th graders study a double bar graph and complete questions based upon the data. Students construct a table to show the data from the...


