Curated OER
Comparing and Ordering Fractions
Young scholars compare and organize different fractions. In this fraction lesson, students use wax paper divided into squares to represent fractions. Young scholars put them in different orders based on their value to complete their...
Curated OER
Measuring to the Nearest Inch
Third graders use whole numbers and fractions to make connections between abstractions of the mathematical world and the real world. In this fractions and measurement lesson, 3rd graders identify, quantify groups , and measure distances....
Curated OER
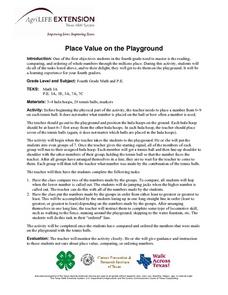
Place Value on the Playground
Fourth graders explore ordering whole numbers through the millions place through a P.E. game on the playground. In small groups they form numbers while standing in hula hoops, telling the teacher what number was made by the combination...
Virginia Department of Education
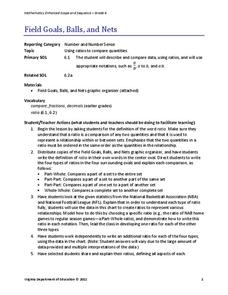
Field Goals, Balls, and Nets
Score a resource on ratios. Young mathematicians learn about different ways to express ratios. Using sports data, they write statements about the statistics in ratio form.
Curated OER
Exponential Growth versus Polynomial Growth
Your algebra learners explore the values of two types of functions in order to compare growth rates in this short cooperative task. Two types of solutions are given, using a table of values and an abstract argument.
Curated OER
An Apple a Day
Students sort and compare apples before making apple prints. For this apple lesson, students use a painting to inspire art prints made with apple halves. Students compare and sort apples.
National Security Agency
Ordering, Adding and Subtracting Integers
Prealgebrarians use colored chips, stickers, and pencils to explore the world of integers. They discover absolute value, compare positive and negative integers, and apply operations to them. A detailed procedure for the three-part lesson...
Curated OER
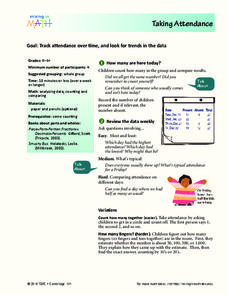
Taking Attendance
Young mathematicians record and analyze data. They will take attendance for their class and compare to other days. Then discuss ways to count who is present. They may also show the amount of students present using fractions.
Curated OER
Proofs of the Pythagorean Theorem
Working individually and collaboratively, geometers gain a clear understanding of the Pythagorean theorem. They create, explain, and compare proofs of the theorem. Proofs involve areas of trapezoids, squares, and triangles, congruent...
Ohio Department of Education
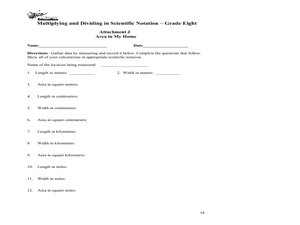
Multiplying and Dividing in Scientific Notation - Grade 8
Here is really nice set of resources on scientific notation. Eighth and ninth graders explore the concept of multiplying and dividing in scientific notation. In this multiplying and dividing numbers in scientific notation instructional...
Illustrative Mathematics
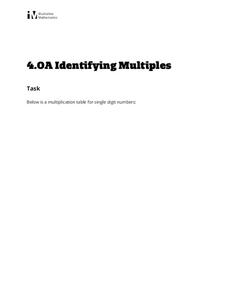
Identifying Multiples
Administer an activity that fosters a child's understanding of multiples. Young mathematicians are guided to complete three tasks on a multiplication chart. Once they color the boxes with multiples of two, three, and four, learners...
Curated OER
Hershey Bar Equivalent Fractions
Fourth and fifth graders explain how to use equivalent fractions. They recognize which fractions are equivalent. Pupils find equivalent fractions.
Curated OER
Making Simple Conversions
Young scholars explore the concept of measurement as it relates to equivalencies. They complete simple conversions using visual models of measurement units, and record their answers in a two-column table.
Indiana Science
How Many E’s?
Seventh graders explore random sampling by estimating the number of e's on the newspaper. They explain the possible error sources for this type of sampling, and compare the accuracy of sampling a small and large population. This is a...
Neufeld Learning Systems
Concept: Ratios and Proportions
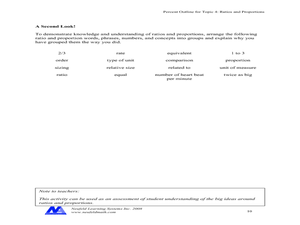
Upper elementary and middle school pupils fill out a chart creating six equivalent fractions and then compare them to six different objects and/or shapes. They group together 16 various terms related to ratios and proportions. Pupils...
Bowland
Mobile Phones
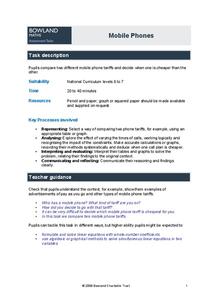
Cheaper cell phone bills? Learners compare two different cell phone plans for a specified number of minutes of phone usage each day. They also determine the conditions for which one plan is cheaper than the other.
Curated OER
Introduction to Exponents
Problem solve using exponents. Pupils read One Grain of Rice: A Mathematical Folktale and write powers to represent amounts from the story.They compare actual solutions to their predictions and play a game to practice using exponents.
Curated OER
Incredible Integers!
There are three parts to this lesson on integers. In the first, learners explore positive and negative numbers on an actual painter's tape number line and by playing a "Hot Seat" game. In part two, they view a BrainPop video and work...
Kenan Fellows
How Does an Unhealthy Diet Influence our Health and Well-Being?
You are what you eat, or so they say! After surveying family and friends on a week of eating habits, learners analyze the data for patterns. They compare different variables such as fats and cost, fats and calories, or fats and LDLs.
EngageNY
Margin of Error When Estimating a Population Proportion (part 1)
Use the power of mathematics to find the number of red chips in a bag — it's a little like magic! The activity asks learners to collect data to determine the percentage of red chips in a bag. They calculate the margin of error and...
Curated OER
Spoonfuls, Cupfuls and Handfuls
Explore the use of non-standard units for measuring volume with elementary learners. They fill a container and count the number used using cups, spoons, and bottles, build with blocks and count the number of blocks used, and compare and...
Curated OER
Modeling: Having Kittens
Cats can't add, but they do multiply! Determine the number of descendants of a single cat given specific facts about cats and kittens. The lesson focuses on developing strategies for problem solving using both individual and group work....
Illustrative Mathematics
Weather Graph Data
Teaching young mathematicians about collecting and analyzing data allows for a variety of fun and engaging activities. Here, children observe the weather every day for a month, recording their observations in the form of a bar graph....
Math Warehouse
Theoretical Probability Activity
If you keep rolling a die, you'll roll a five exactly one-sixth of the time—right? A probability lesson prompts young mathematicians to roll a die 100 times and use the data to calculate empirical probabilities. They then compare these...


