Curated OER
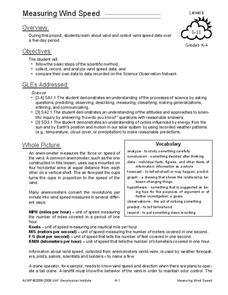
Measuring Wind Speed
Students study wind speed and collect wind speed data. In this wind speed lesson, students visit a website to learn about the local wind speed forecast for their week. Students discuss wind and wind speed. Students collect wind speed...
Curated OER
Investigation: Peg Race
Young scholars explore competition by participating in a peg race. In this pattern creation lesson, students utilize an egg timer and pegs or colored cubes to create patterns quickly while competing with fellow classmates to finish...
Curated OER
Mathematics Within: Bar And Pie Graphs
Students compare and contrast the use of bar and pie graphs with the same data. They create a data set by surveying all students in the class using sticky notes to make a table on the board. Then, each student creates a bar and pie graph...
Curated OER
Activity Plan 5-6: Searching for Shapes
Students explore the shapes all around them. In this early childhood lesson plan, students use their creative thinking skills to compare shapes to the form ob objects in their classroom.
Curated OER
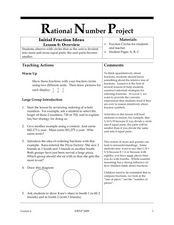
Initial Fraction Ideas Lesson 6: Overview
Students use fraction circles to observe fractions in smaller parts and to complete charting and word problem activities. In this fraction lesson plan, students complete chart problems, word problems, and fraction comparing problems...
Curated OER
Addition and Subtraction in Center Time
First graders complete center activities as they practice their addition and subtraction skills. They listen to Rick Walton's, "How Many, How Many, How Many" before playing games, and completing addition and subtraction worksheets at...
Curated OER
Let's Go Shopping with $500
Third graders use a worksheet to budget a five-hundred dollar shopping spree. They select goods to purchase, figure totals and then calculate discounts and sales tax. They compare results to determine who purchased the most for his or...
Curated OER
Healthy Snacks. Healthy Packaging
Fourth graders research how to select the most cost-effective snacks. In this consumer practices lesson, 4th graders compare packaging labels and come to conclusions on how cost effective the product is. Students discuss their findings.
Curated OER
Factors, Divisibility, and Relatively Prime
Seventh graders explore the concept of divisibility. In this divisibility lesson, 7th graders use divisibility rules to find factors of numbers. Students create foldables to illustrate divisibility rules.
Curated OER
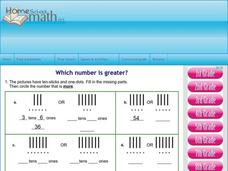
Which Number is Greater?
Pupils draw pictures of two digit numbers to identify the greater value. In this math lesson, students plot two digit numbers on a number line and identify the greatest or lesser value. Pupils use the greater than and less than symbols...
Curated OER
Capture the Circle (A Fraction Game)
Fourth graders compare and order fractions in a fraction game activity. In this fraction game lesson, 4th graders play a game that requires them to add fractions with like denominators and compare fractions. Students create posters where...
Curated OER
Math Lesson: How Many People Live There?
Students are able to calculate the population density of a country, and calculate the population density of large cities in that country. They are able to create an appropriate graph to represent their data for that country.
Curated OER
Guess My Piece -working with Legos
Students participate in guessing their partners' hidden Lego pieces from their verbal clues. They work in partners to accomplish their goals. They are meeting a variety of math standards by completing this lesson.
Curated OER
Olympic records through time
Students compare the records of gold medal Olympic winners for the last 100 years and decide if we are faster, stronger than in the past.
Curated OER
Exploring Altitudes in Math
Students draw and calculate altitudes. They draw the altitude of acute, right and obtuse triangles and calculate the altitude of a triangle using the Pythagorean theorem.
Pennsylvania Department of Education
Using Polygons to Represent Fractions
Explore the world of fractions by using pattern blocks to show how different shapes can divide a hexagon. Elementary schoolers work in groups to complete these problems and to answer questions. Later, they work complete an independent...
NTTI
If You Hopped Like a Frog
Get your frogs hopping by introducing them to the concepts of ratio and proportion. As a class, they perform arithmetic operations using ratios then discover how they represent quantitative relationships. In groups, they write their own...
Pennsylvania Department of Education
What is the Chance?
Fourth and fifth graders make predictions using data. In this analyzing data lesson plan, pupils use experimental data, frequency tables, and line plots to look for patterns in the data in order to determine chance. You will need to make...
Illustrative Mathematics
Counting Overview
Develop automatic, meaningful counting skills with your class by using everyday classroom/school items, objects, and opportunities. Counting skills should be practiced during the year using objects and items they are familiar with and...
Curated OER
Mining Shapes
In this 2-D shapes lesson, kindergarteners review plane shapes attributes. They engage in a shape hunt in the classroom and create art using plane shapes. A good, hands-on lesson!
Curated OER
Defining Division
Upper graders explore division through fair-shares. They will review fair shares and fractions as a segway into division. They start by playing "Share Fairly" game and create mathematical arguments for solving problems. Manipulatives and...
Curated OER
Build a Bar Graph
Learners discover how to use bar graphs. They will gather and organize specific data in order to put it into a bar graph. Then they will answer several questions based on the information they have graphed.
Mathematics TEKS Toolkit
Am I Related to Myself?
Elementary or middle schoolers use ratios to discover some nearly constant relationships between measurements of parts of the human body. They find and record pairs of measurements and determine the relationship between the pairs. Pupils...
Curated OER
Penny Basketball: Making Sense of Data
Explore four web-based interactive sites to develop a baseline understanding of statistics. Learners play a series of penny basketball games and collect data regarding their shooting statistics. Groups decide who is the "top" penny...


