Beacon Learning Center
Twix-n-Tween
Yummy! Use Twix candy bars to teach a lesson in comparing length! Learners will love this lesson and you will be addressing Common Core standards at the same time!
Curated OER
Graphing Grazy Crayons
Children create crazy crayons they made to sort and construct a floor bar graph. Then, using technology resources, they make a simple bar graph to compare the top four colors produced. Students will then interpret the printed graph by...
Curated OER
Thank You... Thomas Edison!
Students investigate the life of Thomas Edison. They research how he made a difference. They understand that accurate data collection is important for math. They create a chart using spreadsheet data.
Curated OER
Olympic Games - Can You Measure Up?
Students complete 6 units to learn about Ancient Greece and the Olympic games through physical education activities as well as math activities. In this Ancient Greece lesson, students complete multiple activities in 6 lessons including...
Curated OER
Measuring Different Surfaces
Fourth graders investigate measurement of linear and curved surfaces. In this math lesson, 4th graders discuss how to measure curved surfaces and work with a partner to measure various curved surfaces.
Curated OER
The Cost of Life
Students research the salary for a career of interest. They consider what kind of lifestyle that career would provide and graph their information for comparison.
Curated OER
Data Shuffle
Students find an advertisement or newspaper using charts or graphs. They create another graph using the same information in a different format. They write a comparison of the two graphs.
Curated OER
Pond Theme Unit
For this pond theme worksheet students research facts on pond life. Students complete comprehension questions, crosswords, word search, and math puzzles. Students write a short report.
Curated OER
Missing Numbers and Writing Equations Practice
For this equation and missing numbers worksheet, students fill in missing numbers in addition and subtraction problems to arrive at given answers, then complete a set of 3 word problems.
Curated OER
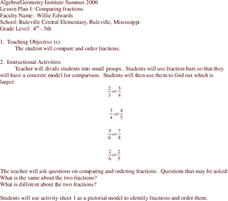
Comparing Fractions
Students investigate concepts of working with fractions. They compare different fractions and put them in chronological order. The quantities are compared as either being larger or smaller also.
Curated OER
Great Graphing
Students collect data, use a computer spreadsheet program to create various graphs, and compare the graphs. They state the findings of each graph in writing and decide which graph type best represents the data.
Curated OER
The Big Hand Challenge
Students utilize a computer spreadsheet to record and analyze data. In this problem solving lesson, students compare their hand size to that of the principal. Students understand standard and nonstandard measurement.
Curated OER
What Would Make Our School More "Green"?
Students survey their school to get ideas for how to make the school more environmentally friendly. In this environmental lesson, students collect data from other students and teachers. They use the data to create graphs and present a...
Curated OER
Surveys and Graphing
First graders survey different classrooms to determine types of products students would like to see sold at school, and create graphs based on survey results.
Curated OER
Heat and Matter
Students explore liquids and solids by conducting in class experiments. In this matter lesson, students define the properties of matter and how heat can change those properties. Students experiment with heating objects such as butter and...
Curated OER
Show Me The Money!
Students select which bank would best meet their needs. In this lesson plan on personal banking, students write a summary stating which bank and bank accounts best suit their own needs.
Curated OER
Technobiz
Learners examine candy preferences to create a plan in order to improve candy sales. In this technobiz lesson, students build spreadsheet and organizational skills by graphing and calculating data. Learners are introduced to terminology...
Curated OER
Crime School Investigations
Students solve a mystery at their school. In this classifying lesson, students find suspects who committed the crime. Students categorize them into race, sex, and fingerprint type. Students show their results in graphs.
Curated OER
Candy is Dandy
Students investigate color distribution in bags of M&Ms They sort and classify the contents of a bag of M&Ms and summarize their findings on a worksheet. Students convert the numbers into charts and make predictions about color...
Curated OER
Predicting Temperature: An Internet/Excel Learning Experience
Third graders use the Internet (www.weather.com) to find the high temperature for our locale and the high temperature for another city around the world. They keep track of the temperature in these two locations for 10 days.
Curated OER
It's a Fact!
Second graders investigate the concept of addition and subtraction while manipulating a variety of different resources. They focus upon the use of the games in order to keep student engagement. Then students are given the opportunity to...
Curated OER
"One Day in the Prairie" by Jean Craighead George
Students collect "prairie insects" for data collection and analysis.
Curated OER
Car Maze competition
Students use graphs to calibrate an RCX car. They must then program the car to traverse a maze using their calibrations
Curated OER
RCX Car Line Graph
Students develop a line graph based on distances that an RCX car drives in specified amounts of time. They then are given a specific amount of time for the car to drive and be asked to extrapolate the car's distance from the graph.


